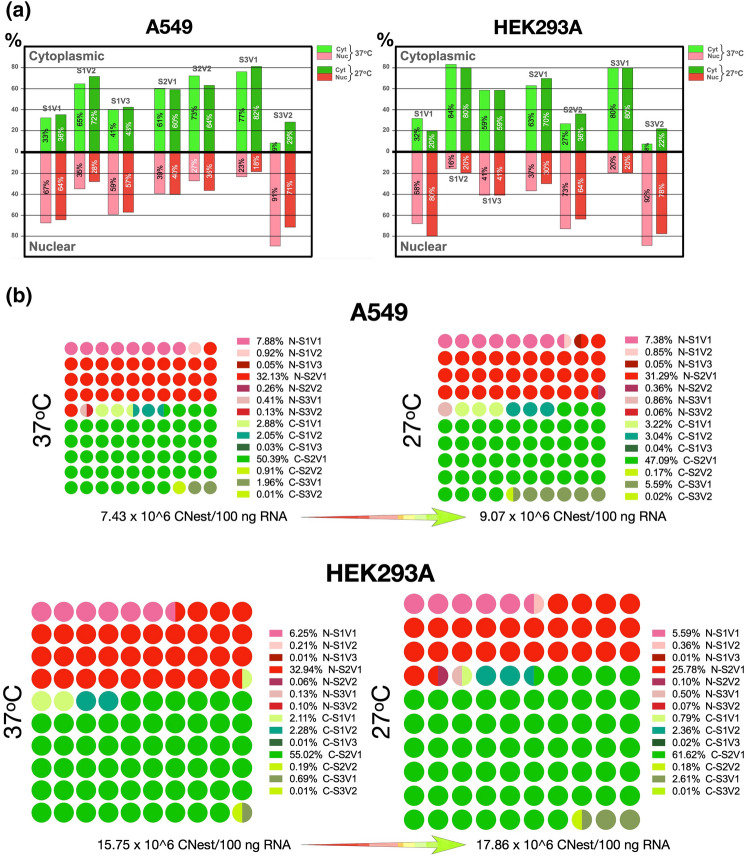
Figure 5.
The nucleocytoplasmic distribution of the SUMO variants is differentially regulated upon cold-shock. Cells maintained for 24 h at either 37 °C or 27 °C (cold-shocked) were collected, lysed, and separated into nuclear and cytoplasmic fractions. Total RNA was purified from each fraction and used to estimate nuclear and cytoplasmic CNest for each variant. The data presented correspond to the average values from triplicate measurements obtained in three independent experiments. (a) Nucleocytoplasmic distribution of each variant under normalcy (37 °C) and cold-shock (27 °C). In each case, the sum of the nuclear and cytoplasmic fractions equals 100% of the total transcript present in the cell for that variant. (b) Dot matrices (10 × 10 dots, 100 dots per matrix) representing the nucleocytoplasmic distribution of each variant as a fraction of the total amount of SUMO transcripts present in the cell under normalcy (37 °C) and cold-shock (27 °C). The total SUMO transcripts were calculated by adding the CNests obtained for the nuclear and cytoplasmic fractions for each variant. The respective abundance of each variant, indicated as a percentage of the total, was calculated and is represented as dots. Each dot represents 1% of the total SUMO transcripts in the cell. The area of the dot matrix is proportional to the total amount of SUMO transcripts present; thus, the total CNest for SUMO transcripts under cold-shock for HEK293A cells is the largest of all, whereas the one for A549 cells under normalcy is the smallest of all. The nuclear fractions are shown in shades of red, while the cytoplasmic fractions are shown in shades of green. The actual percentage corresponding to each variant is shown with their respective color code. The calculated average CNest values for all SUMO transcripts per 100 ng of total RNA under normalcy and cold-shock for each cell line are shown under each matrix. The growing-colored arrows indicate the increase in copy number and cytoplasmic distribution observed upon cold-shock. The data presented represents the average of three independent experiments each measured in triplicate. For the corresponding data presented as bar graphs with error lines, see Supplementary Fig. S5.

