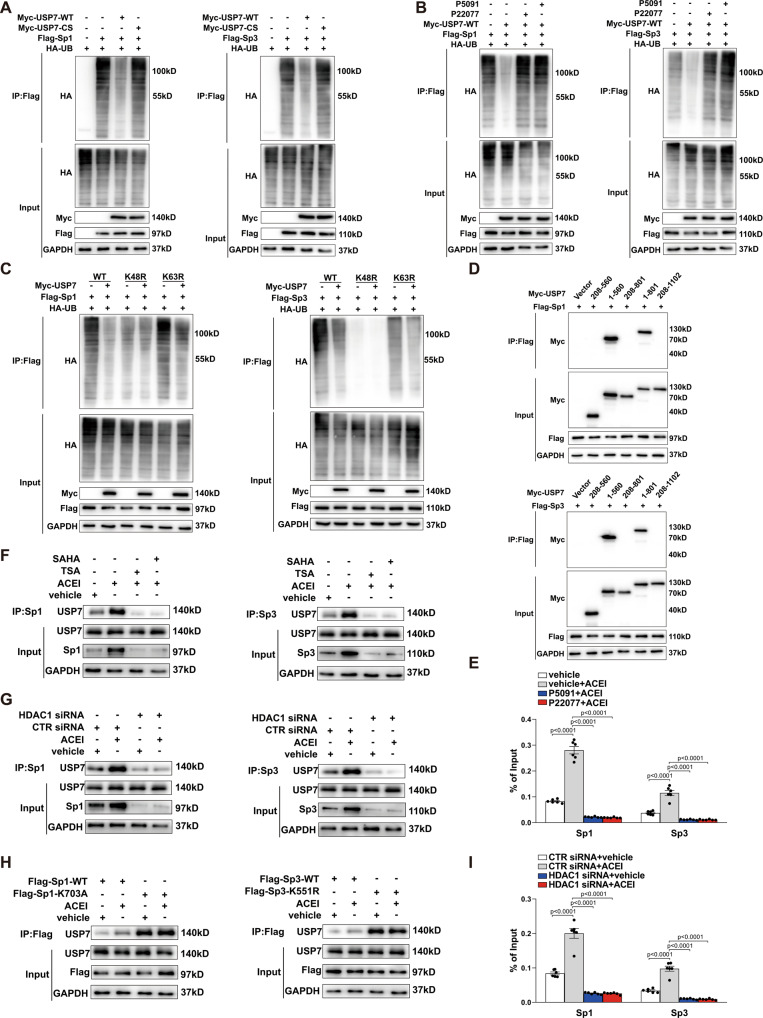
Fig. 5. ACEI stabilizes Sp1/Sp3 protein via USP7-mediated deubiquitination.
A Representative western blot of HA-ubiquitin after anti-Flag immunoprecipitation of HEK293T cells ectopically expressing Flag-Sp1 (left) or Flag-Sp3 (right) either alone or in combination with Myc-USP7-WT or Myc-USP7-CS (C233S). B Representative western blot of HA-ubiquitin after anti-Flag immunoprecipitation of HEK293T cells ectopically expressing Flag-Sp1 (left) or Flag-Sp3 (right) either alone or in combination with Myc-USP7-WT treated with USP7 inhibitors P22077 or P5091. C Representative western blot of HA-ubiquitin after anti-Flag immunoprecipitation of HEK293T cells ectopically expressing Flag-Sp1 (left) or Flag-Sp3 (right), either alone or in combination with HA-ubiquitin-WT or mutant (K48R or K63R). D HEK293T cells ectopically expressing Flag-Sp1 (left) or Flag-Sp3 (right) were co-transfected with Myc-USP7 deletion mutants, as indicated. The interactions were analyzed using the Co- immunoprecipitation assay. E Chromatin immunoprecipitation (ChIP) assay showing binding of Sp1 or Sp3 to the NOTCH1 promoter in HUVECs treated with ACEI either alone or in combination with P22077 or P5091. n = 6. F Representative western blot analysis for USP7 after anti-Sp1 (left) or anti-Sp3 (right) immunoprecipitation of HUVECs treated with ACEI either alone or in combination with the HDAC1 inhibitor SAHA or TSA. G Representative western blot analysis of USP7 after anti-Sp1 (left) or anti-Sp3 (right) immunoprecipitation of HUVECs transfected with CTR siRNA or HDAC1 siRNA, in combination with or without ACEI. H Representative western blot analysis of USP7 after anti-Flag immunoprecipitation of HUVECs ectopically expressing Flag-Sp1-WT (left, Flag-Sp3-WT) or Flag-Sp1-K703A (right, Flag-Sp3-K551R) treated with or without ACEI. I ChIP assay showing the binding of Sp1 or Sp3 to the NOTCH1 promoter in HUVECs transfected with CTR siRNA or HDAC1 siRNA, in combination with or without ACEI. n = 6. Two-way ANOVA followed by Bonferroni multiple-comparison analysis was employed for E and I. Data are presented as mean ± SEM. Source data are provided as a Source Data file.

