
Figure 3.
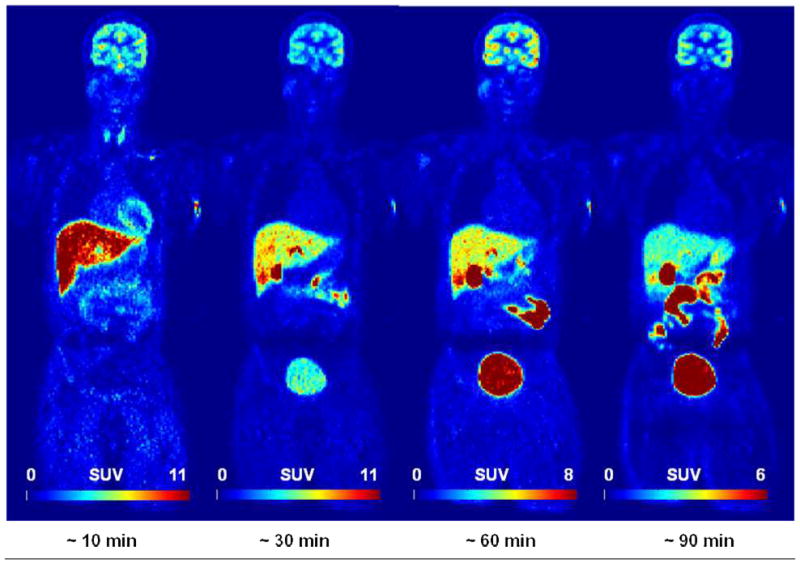


Figure 3A. [18F]FPEB whole-body PET images 0–10, 10–30, 30–60, and 60–90 min after injection of 177.6 MBq (4.8 mCi) in 33 year-old male (73 kg) with specific activity of 15.0 Ci/μmol and FPEB mass of 0.07 μg. GB was the critical organ for SUV ranges. (Decay non-corrected at four time points and decay-corrected within each time point).
Figure 3B. Tissue time-activity curves of non-decay corrected 18F activity using standardized uptake values for various organs (GB, Gallbladder; UB, Urinary Bladder; SI, Small Intestine; LV, Liver; BR, Brain; KD, Kidney; BM, Bone Marrow; HT, Heart; SP, Spleen; TH, Thyroid). Values are mean (± standard error of the mean (SEM)) standardized uptake values (in grams per milliliter)
Figure 3C. Comparison of radiation dose estimates of [18F]FPEB in human, based on PET images (this work) with the dose estimated from non-human primate (rhesus monkey) (12) and [18F]SP203 in humans (14). Absorbed radiation doses (μGy/MBq) were changed to equivalent doses (μSv/MBq). Values are expressed as mean ± SEM.