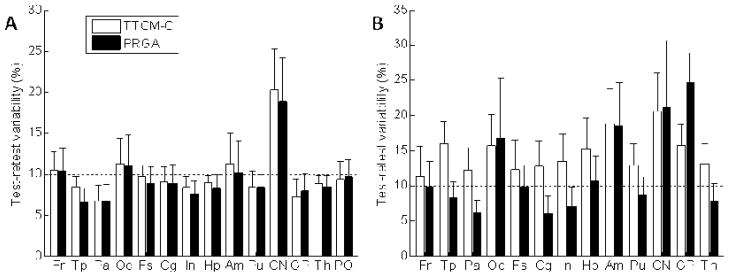
Figure 6.
Histograms (means with SEM bars) of regional estimates of test-retest variability (equation provided in Methods section) and Test-/Retest Variability for VT (Panel A) and BPND (Panel B) given by TTCM-C and PRGA. A 10% level, generally accepted criteria for reproducibility, is shown by horizontal dotted lines.

