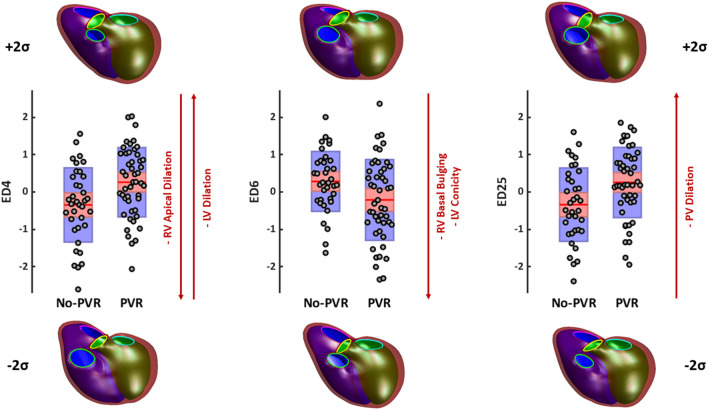
Figure 2.
Shape modes that have significant associations with PVR status. Box plots show mean (red line), 95% confidence intervals of the mean (pink shaded bar), and one standard deviation of the mean (blue shaded bar) for Z-scores (gray circles). Models show mean ED shape plus two standard deviations (top) and minus two standard deviations (bottom) for each mode. The LV endocardial surface, RV endocardial surface, and epicardial surface are shown in green, purple, and maroon, respectively. The mitral, tricuspid, aortic, and pulmonary valves are shown in cyan, pink, yellow, and green, respectively. LV Left ventricular, PV Pulmonary valve, RV Right ventricular.

