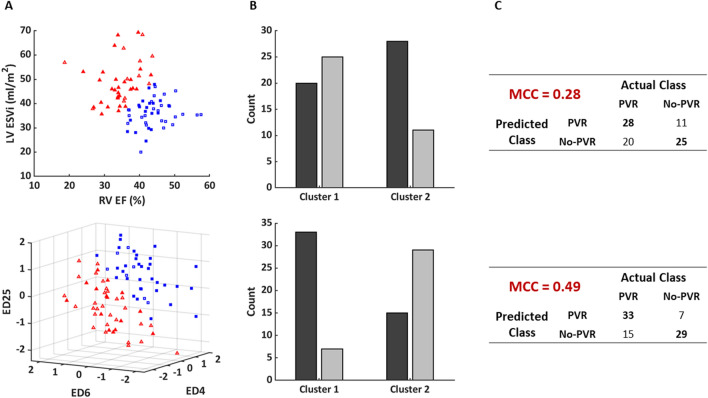
Figure 3.
Summary clustering results depicting the ability of imaging indices (top) and shape modes (bottom) to discriminate PVR status. (A) K-means clustering using features with the most significant associations with PVR status with two clusters (blue squares: cluster 1; red triangles: cluster 2; filled: PVR; open: No-PVR). (B) Number of patients in the PVR (dark gray bars) and No-PVR (light gray bars) cohorts in each cluster. (C) Matching matrix and MCC performance metric for classifying patients by PVR status. EF Ejection fraction, ESVi End-systolic volume index, LV Left ventricular, MCC Matthews correlation coefficient, RV Right ventricular.

