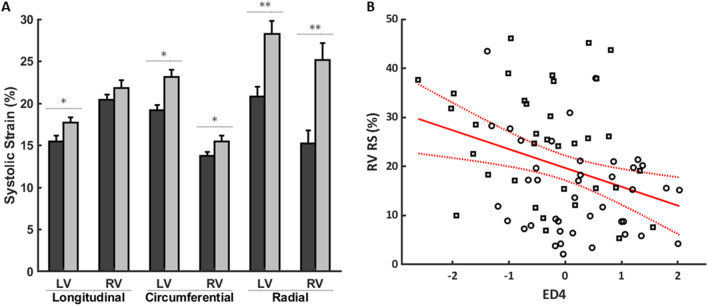
Figure 4.
Geometric strain analysis. (A) Summary systolic strains (%) grouped by PVR status (PVR: dark gray bars; No-PVR: light gray bars). Data are reported as mean ± standard error. Systolic CS and LS are conventionally negative, but their absolute values are shown for simpler interpretation. Systolic strains that have significant associations with PVR status after accounting for sex, type of repair, time after repair, and BSA are denoted with symbols (*p < 0.05; **p < 0.01). (B) Univariate regression model between RV RS (%) and ED4 (black circles: PVR; black squares: No-PVR; red solid line: linear fit; red dotted lines: 95% confidence bounds; p < 0.01; r = 0.33). LV Left ventricular, RS Radial strain, RV Right ventricular.

