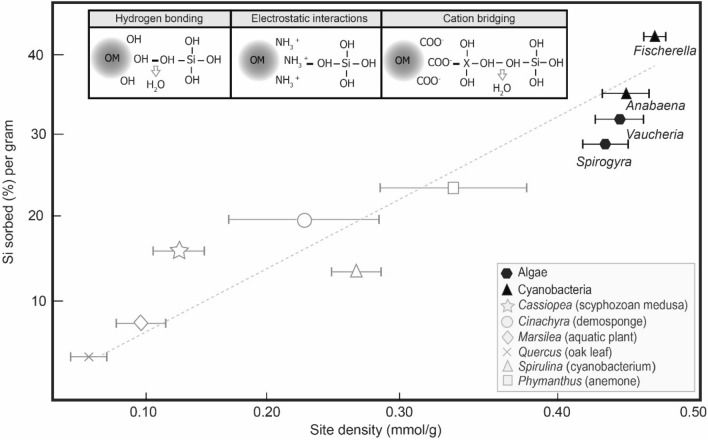
Figure 3.
Potentiometric titration results. Mean reactive site density (mmol/g) for experimental organisms, plotted against Si absorbed, measured at the end of each experiment (150 h), and normalized to the average initial weight of each specimen. Error bars represent the standard deviation. Illustrations along the top of the panel represent the molecular bonding of silica to (from left to right) hydroxyl, amino, and carboxyl groups of organic matter (OM) (Ref.54). “X” represents a metal cation. Gray symbols denote data from Ref.16. Black symbols represent new data produced for this study. Line denotes best-fit approximation of all these data (y = 83.694x − 10.604; R2 = 0.7795).

