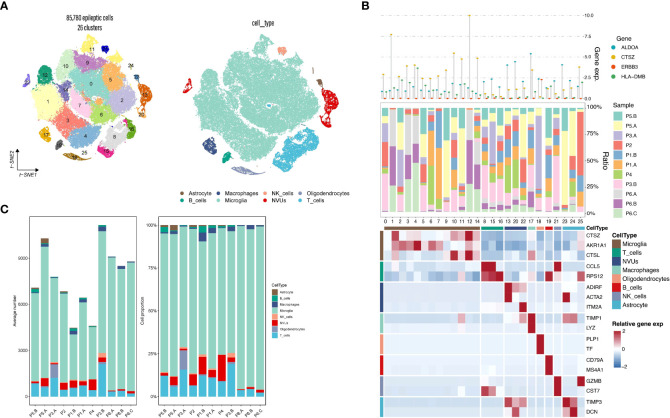
Figure 7.
Epilepsy single-cell analysis. (A) Single-cell subpopulation clustering and cell annotation. (B) Three-layered complex heatmap of selected co-expressed genes in each cell cluster. Top: Mean expression of co-expressed markers. Middle: Tissue preference of each cluster; Bottom: Relative expression map of known marker genes associated with each cell subset. Mean expression values are scaled by mean-centering, and transformed to a scale from -2 to 2. (C) Average cell number and relative proportion of subsets from tissues of each origin.

