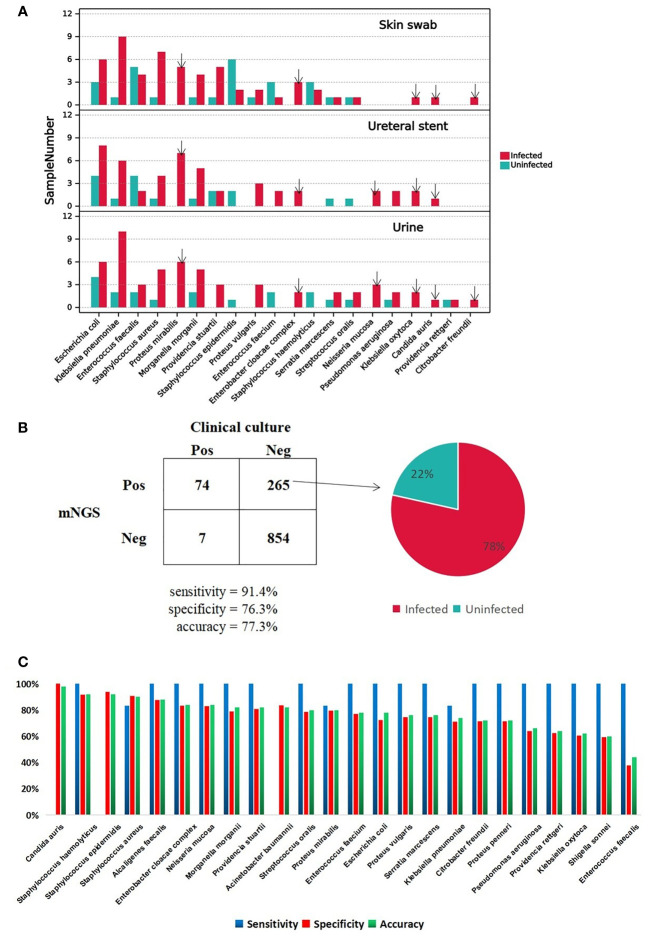
Figure 2.
A Major positive microorganism of Clinical culture in Skin swab, Ureteral stent and Urine. The arrow marks the species detected only in Infected group. B The comparison of performance between Clinical culture and mNGS. The pie chart shows the proportion of false-positive microorganism identified by mNGS in Infected group versus uninfected group. C. The mNGS performance of each pathogen comparing with clinical culture.

