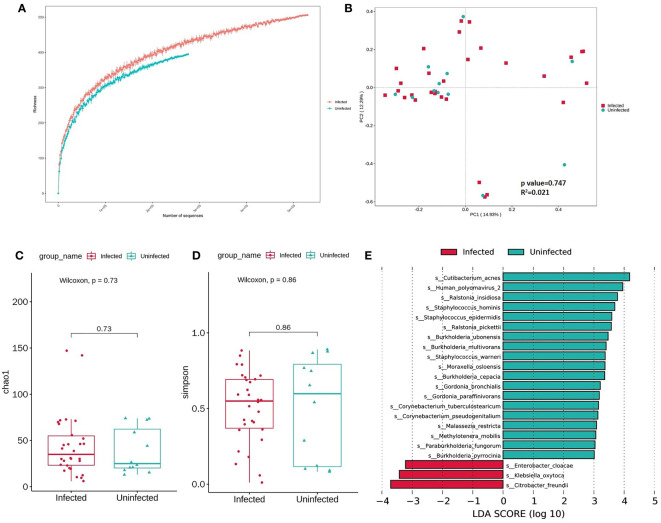
Figure 3.
(A) Rarefaction curves for species number in Infected(n=35) and Uninfected (n = 15) after 100 random sampling. The curve in each group is near smooth when the sequencing data are great enough with few new species undetected. (B) Weighted Principal Coordinate Analysis (PCoA) using Bray-Curtis distance based on the relative abundance in 50 samples. Significant differences across groups are established at the first principal component (PC1) values and PC2, and shown in the box plots above. (Wilcoxon, P=0.747, R2 = 0.021). (C, D) Comparison of α diversity (as accessed by Chao1 index and Simpson index) based on the genus profile in two groups for Chao1 index, P=0.73; for Simpson, P=0.86. P values are from Wilcoxon test. (E) Boxplot of 22 differentially enriched species across Infected and Uninfected group based on Lefse.

