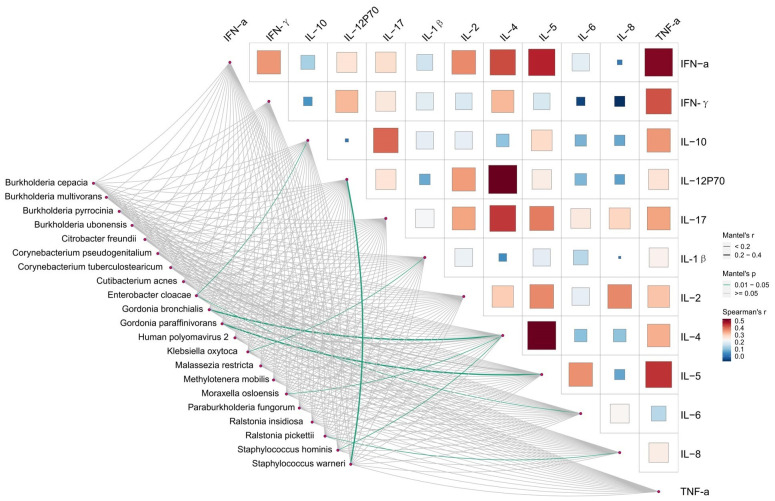
Figure 4.
Relationships between Inflammatory factors and microbiome diversity. Pairwise comparisons of Inflammatory factors with a color gradient denoting Spearman’s correlation coefficients. Taxonomic groups were related to each Inflammatory factors by mantel test. Green line indicates the significant relationship and gray line indicates the unsignificant relationship. Line width means the weight of regression coefficient.

