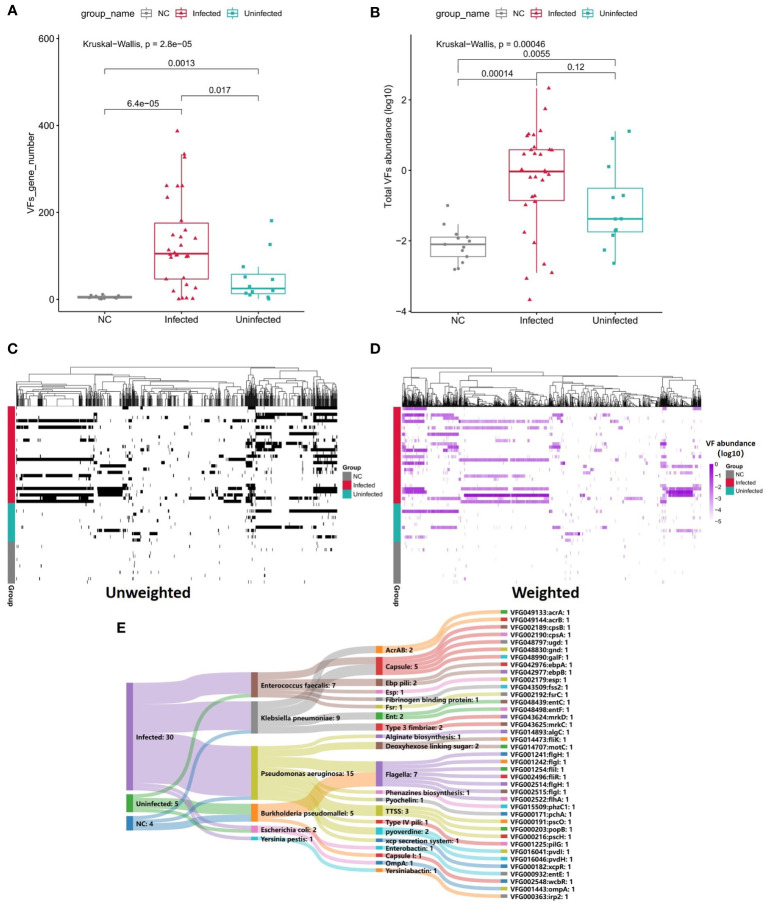
Figure 5.
(A) Boxplot shows the number of VFs among three groups. P values are from Wilcoxon test. (B) Boxplot shows the LOG10-based abundance of VFs among three groups. P values are from Wilcoxon test. (C) Heatmap (unweighted) shows the association between VFs and samples. Black shows the identification of the VF while white shows no identification of the VF. (D) Heatmap (weighted, MaxAbs method) shows the association between VFs and samples. Shades of purple shows the abundance of the VF, the deeper the color, the higher the abundance. The normalization was through MaxAbs method. That is, the abundance of each gene is divided by the absolute value of the maximum VF abundance in all samples, and then log10 is further taken. VF even abundance=log (VF abundance/|Max VF abundance|). As for VF abundance=0, VF even abundance=-5. (E) Sankey map for differential VFs, Based on VF abundance profile, set LDA=3 to screen the enriched VFs in Infected group, Uninfected group and controls, and set VFs annotation information (VFs type, species attribution) in VFDB database.

