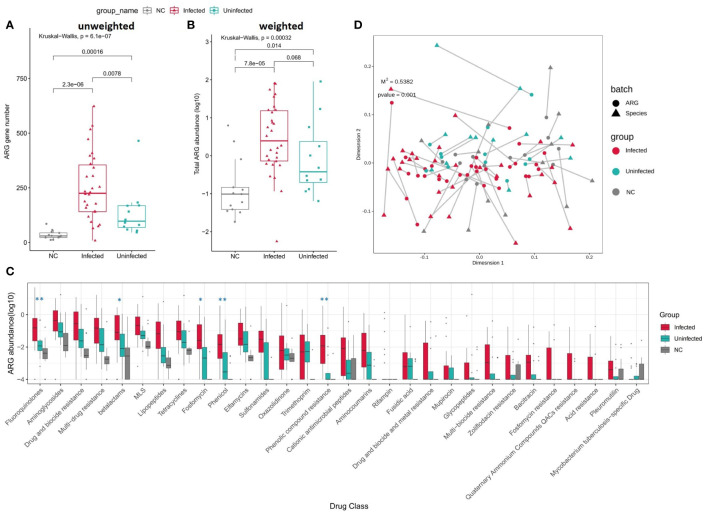
Figure 6.
(A) Boxplot shows the number of ARGs among three groups. P values are from Wilcoxon test. (B) Boxplot shows the LOG10-based abundance of ARGs among three groups. P values are from Wilcoxon test. (C) Boxplot shows the LOG10-based abundance of ARGs of each drug class among three groups. (Wilcoxon,*: 0.01<p<0.05,** :p<0.01) (D) Procrustes analysis of the correlation between ARG profiles and species community structure on the base of Bray-Curtis matrices.

