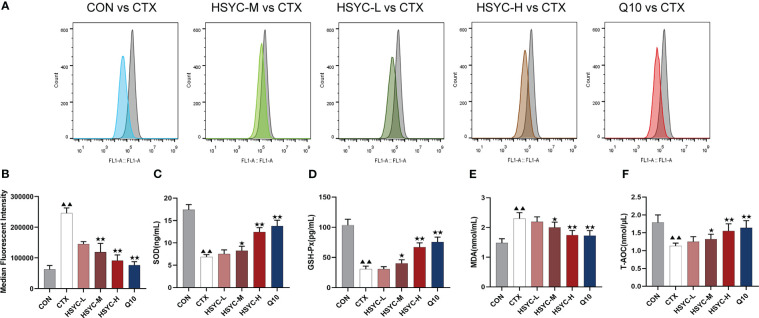
Figure 3.
HSYC decreased oxidative stress of POI afflicted mice. (A) Flow cytometric analysis of ROS accumulation in ovarian granulosa cells of different groups, and histogram plots represents means with SD of median fluorescence intensity (B). (C-F) the levels of serum superoxide dismutase, glutathione peroxidase, malondialdehyde and total antioxidant capacity of mice in different groups. Histogram elements represent the mean ± SD (n=6). ▲▲ presents P< 0.01 compared to the CON group; ★presents P < 0.05 compared to the CTX group; ★★presents P<0.01 compared to the CTX group. SOD, superoxide dismutase; GSH-Px, glutathione peroxidase; MDA, malondialdehyde; T-AOC, total antioxidant capacity.

