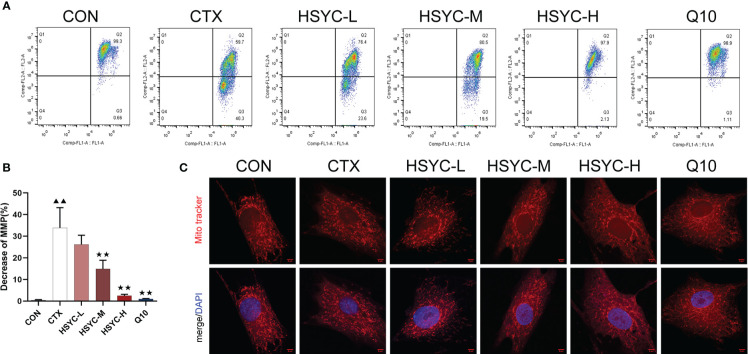
Figure 4.
HSYC improved mitochondrial dysfunction in ovarian granulosa cells of POI afflicted mice. (A) Flow cytometric analysis of mitochondrial membrane potentials degradation, Q2 represents granulosa cells with normal mitochondrial membrane potentials and Q3 represents granulosa cells with decreased mitochondrial membrane potentials. (B) The histogram plots means with SD of flow cytometric analysis of mitochondrial membrane potentials degradation. Histogram elements represent the mean ± SD (n=3). ▲▲ presents P < 0.01 compared to the CON group; ★★presents P < 0.01 compared to the CTX group. (C). Observation of mitochondria morphology by MitoTracker Red staining. Red color represents the mitochondria and blue represents nucleus of granulosa cells. Scale Bar: 5µm.

