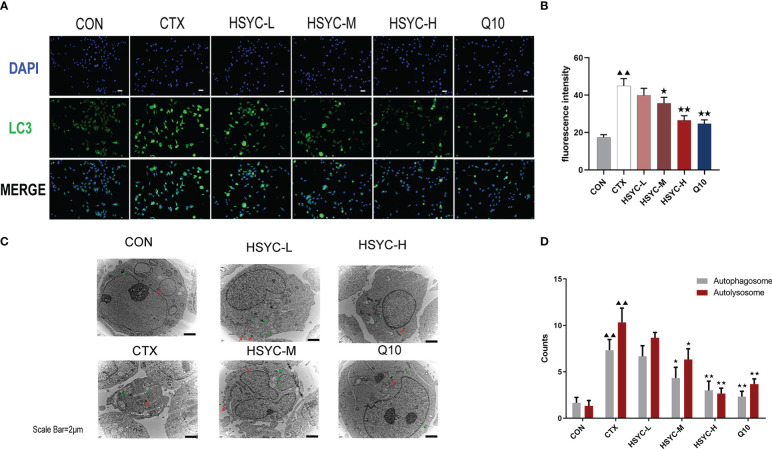
Figure 5.
HSYC improved autophagy in GCs of POI afflicted mice. (A, B) Immunofluorescence images of the LC3. Green color represents the LC3 and blue represents nucleus of granulosa cells. Scale bar: 25μm. The result is shown using histogram plots means with SDs represent LC3 fluorescent intensity levels. (C, D). Observation of autophagosomes and autophagolysosomes in granulosa cells of different groups under transmission electron microscopy. Scale bar:2μm. The result is shown using histogram plots means with SDs represent autophagosome and autophagolysosome counts. Histogram elements represent the mean ± SD (n=3). ▲▲ presents P < 0.01 compared to the CON group; ★presents P < 0.05 compared to the CTX group; ★★presents P < 0.01 compared to the CTX group.

