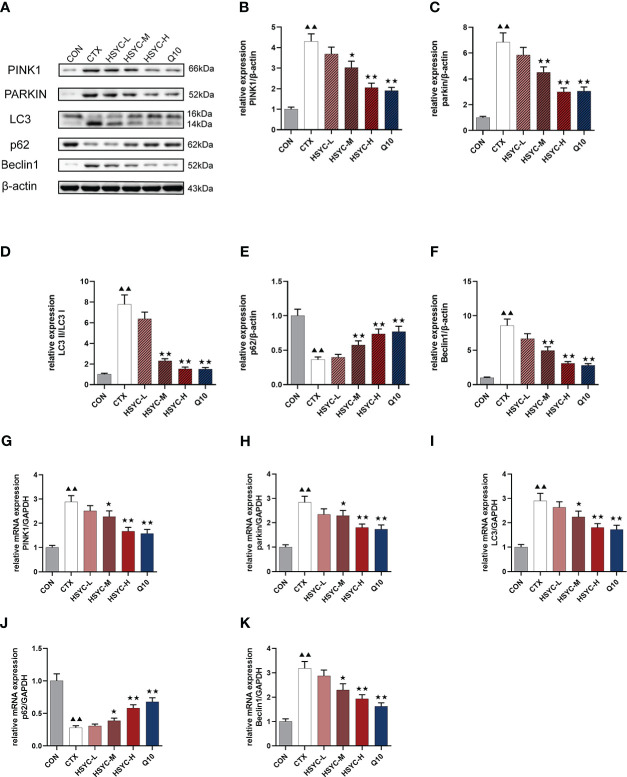
Figure 6.
Effect of HSYC on the expression of mitophagy-associated genes and proteins. (A-F) Effect on PINK1, Parkin, LC3, Beclin1 and p62 proteins in the granulosa cells of different groups. (G-K) Effect on PINK1, Parkin, LC3, Beclin1 and p62 mRNAs in the granulosa cells of different groups. Histogram elements represent the mean ± SD (n=3). ▲▲ presents P < 0.01 compared to the CON group; ★presents P < 0.05 compared to the CTX group; ★★presents P < 0.01 compared to the CTX group.

