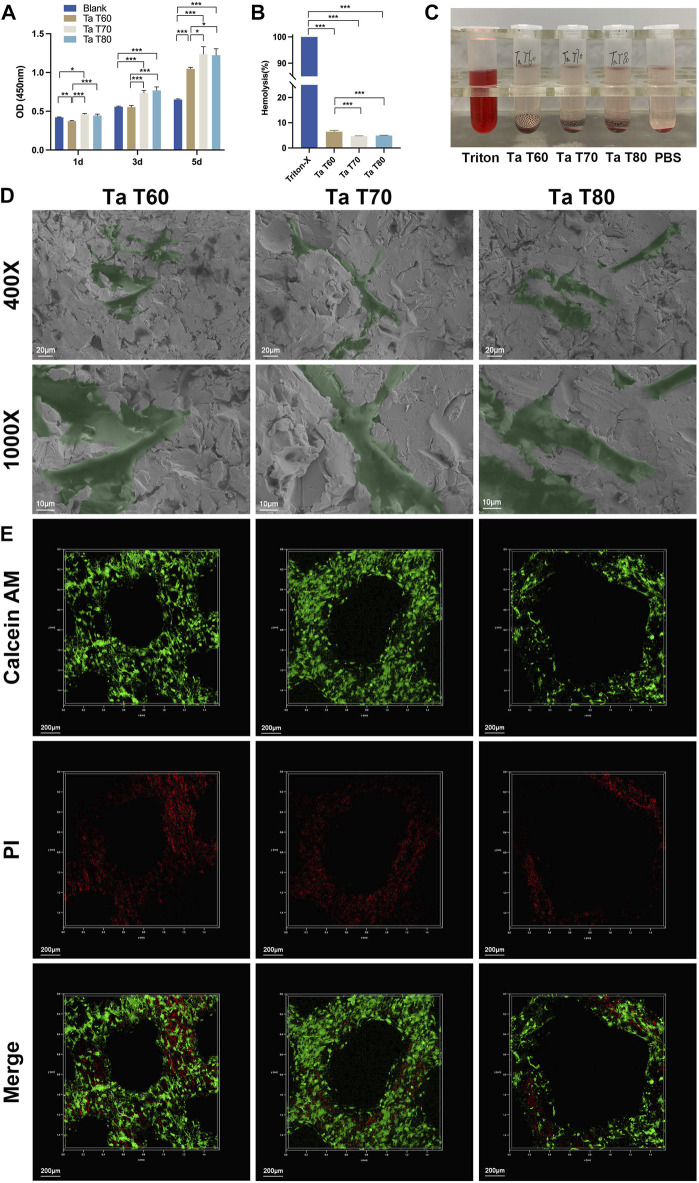
FIGURE 2.
In vitro cytocompatibility of porous tantalum scaffolds and their effects on the growth of rBMSCs. (A) Activity of rBMSCs cultured on each tantalum scaffold for 1, 3 and 5 days. Quantitative analysis (B) and qualitative analysis (C) of hemolysis of blood cells cultured with tantalum scaffolds. (D) Representative SEM images of rBMSCs grown in the surface of tantalum scaffolds for 1 day. (E) Live/dead cell staining for rBMSCs cultured on tantalum scaffolds for 7 d. Data are represented as mean ± standard deviation (SD). (n = 3, *p < 0.05; **p < 0.01; ***p < 0.001.

