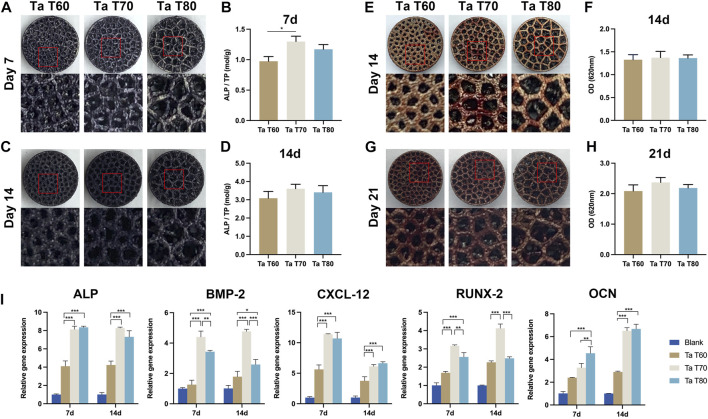
FIGURE 3.
In vitro osteogenic effect of rBMSCs in each porous tantalum scaffold. (A) and (C) Appearance of ALP staining at 7d and 14d. (B) and (D) Quantitative assessment of ALP activity at 7d and 14d of culture. (E) and (G) Appearance of alizarin red staining at 14d and 21d. (F) and (H) Semi-quantitative analysis of alizarin red staining. (I) Osteogenesis-related gene expression at 7d and 14d of culture. Data represent mean ± SD. (n = 3, *p < 0.05; **p < 0.01; ***p < 0.001).

