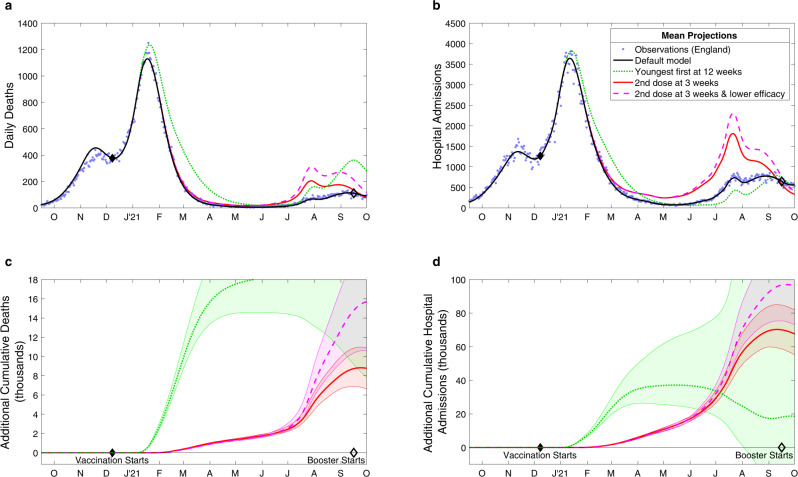
Fig. 1. Projected changes in daily deaths (a, c) and hospital admissions (b,d) with differing vaccination patterns.
a, b Compares the observed levels of severe outcomes (deaths or hospital admissions, blue dots) with (i) the default model projection using the recorded pattern of vaccination (black solid line) and alternative models where this pattern is perturbed: (ii) the ordering of vaccination is reversed so that younger adults are vaccinated first (green dotted line); (iii) vaccinations are given 3 weeks apart although the total number of daily doses administered is unaltered (red solid line); and (iv) the same 3-week strategy as the red line, but accounting for lower efficacy from the shorter dose interval (pink dashed line). c, d The cumulative additional deaths (c) and hospital admissions (d) projected from alternative assumptions, showing 95% prediction intervals (shaded regions) as well as mean values (lines). All results are from model simulations using 400 samples from the parameter posterior distributions.

