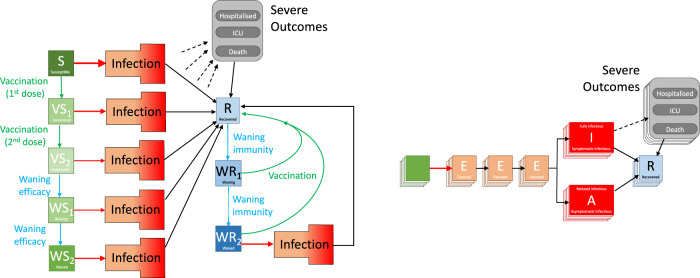
Fig. 3. Graphical schematic of the models used in the paper.
The left-hand schematic shows the progress between different compartments. Infection is shown as a red arrow (with the size providing some indication of the risk), recovering is shown by black arrows, the two-dose vaccination is shown in green, while waning protection is in light blue. The infection compartment is multi-dimensional and shown in the right-hand schematic. It captures infection, the multiple latent classes and whether the infectious class is associated with symptomatic or asymptomatic infection. Each compartment is shown as multi-layered to indicate additional age-, regional- and variant-specific heterogeneity. Severe outcomes of hospital or ICU admission and death (shown with dashed arrows) are related to the level of infection in each age-group and their degree of vaccine (or infection-induced) protection.

