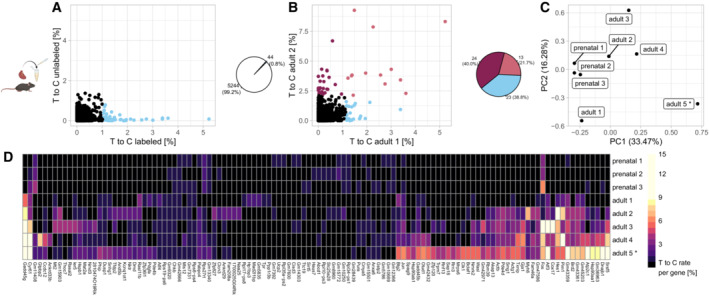
Figure 2. Variation of dissociation response in similar samples.

- T‐to‐C rates per gene in labeled (4sU added) and unlabeled (no 4sU added) adult mouse cardiomyocytes. Blue (~ 1% of genes): T‐to‐C rate ≥ 5 SD.
- Comparison of the labeled sample in (A) to a biological replicate. Genes with T‐to‐C rate ≥ 5 SD in one or both samples are highlighted.
- Principal component analysis of dissociation response in prenatal and adult cardiomyocytes. PCA was calculated based on T‐to‐C rates of all genes which had a T‐to‐C rate >= 1 SD of the mean in at least one sample. Sample adult 5 was dissociated at 42°C, all others at 37°C.
- Heatmap showing consensus and sample specific dissociation response. Genes shown have a T‐to‐C rate >= 5 SD of the mean in at least one sample. Sample adult 5 was dissociated at 42°C, all others at 37°C.
