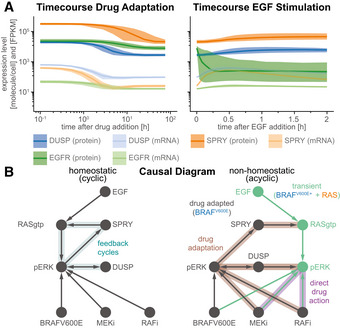
Figure 3. Transcriptional feedback imprints a sparse drug adapted state.

- Simulated time courses of pre‐ (left) and post‐stimulation (right) protein (dark colors) and mRNA (light colors) expression levels of genes that are subject to transcriptional control by pERK. Solid lines show median values, shading indicates variability across 80% of 50 best parameter sets.
- Schematic of the structural causal model for the effect of RAFi and MEKi on pERK under homeostatic (left) and non‐homeostatic (right) conditions. Drug adapted signaling elements are in gray, transient signaling elements are in cyan. Feedback cycles have blue shading (left only). Drug adaptation effects have brown shading and direct drug action has purple shading (right only).
