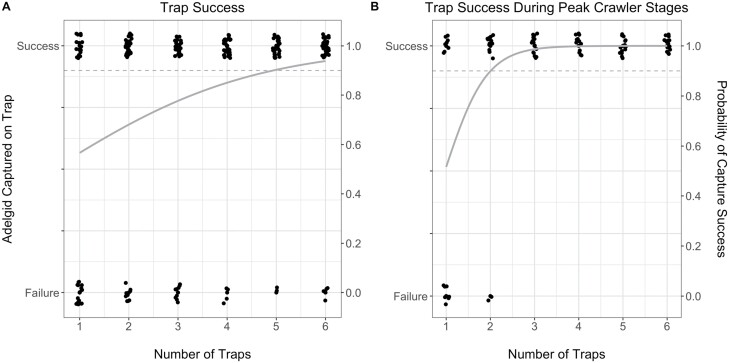
Fig. 6.
Logistic regression estimating probability for the number of traps needed to capture HWA within a 3-acre area. (A) Logistic regression based on data collected from the active crawler season (April 21–July 28); (B) Logistic regression based on data collected from the peak crawler season (May 19–June 16). Each dot represents either a trap success (adelgid captured) or a trap failure (adelgid not captured) for each sampling period. The dashed grey line indicates the 0.9 detection probability.

