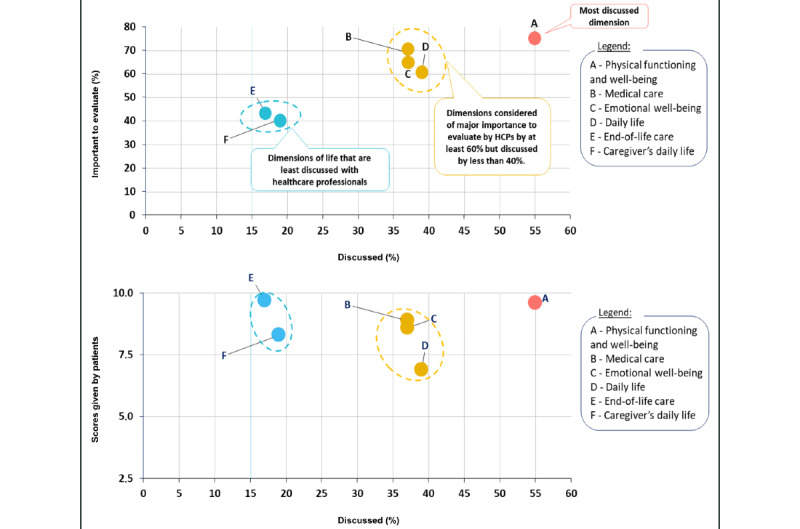
Figure 1.

QoL dimensions evaluated by HCP. Upper part: The x-axis indicates the proportion of patients stating that the respective dimension was evaluated by their HCP; the y-axis indicates the proportion of patients indicating these dimensions to be important for discussions with their HCP. Lower part: The x-axis indicates the proportion of patients who state that the respective dimension was evaluated by their HCP; the y-axis shows the average value score given by patients. HCP: health care professional; QoL: quality of life.
