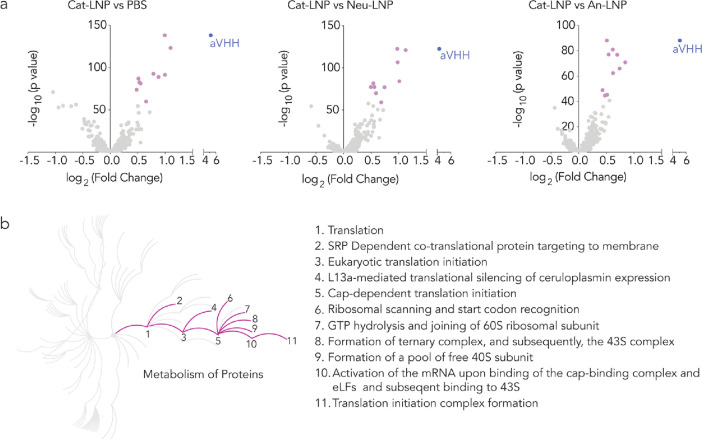
Figure 5.
Cat-LNP significantly changes the transcriptomic profile of lung ECs and leads to upregulation of pathways related to metabolism of proteins (R-MMU-392499). (a) Differentially expressed genes in lung ECs in response to Cat-LNP when compared to control groups, i.e., PBS, Neu-LNP, and An-LNP. Purple dots represent the top 10 upregulated genes, P-value < 0.05. (b) Reactome pathway analysis with significantly upregulated pathways highlighted and listed, P-value < 0.001.

