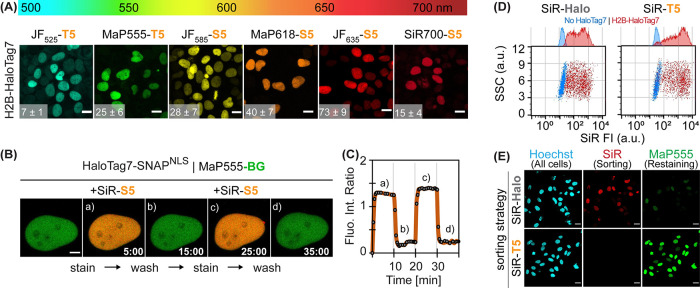
Figure 4.
(A) Live-cell confocal images of different fluorescent xHTL probes covering the visible spectrum. Histone2B-HaloTag7 (H2B-HaloTag7) expressing U2OS cells stained with 500 nM xHTLs. Sum projections. Scale bars: 10 μm. Signal-over-background ratios (S/B) are indicated in the bottom left corner (n ≥ 50 cells, mean ± standard error of the mean). (B) Reversible cellular staining using xHTLs. Live-cell confocal images of U2OS expressing HaloTag7-SNAPNLS (nuclear localization signal) covalently labeled with MaP555-BG and iteratively stained with 500 nM SiR-S5 or washed with an imaging medium (10 min cycles). Sum projections. Scale bar: 2 μm. Images recorded every 30 s. (C) Intensity-time-trace given of the experiments shown in B. Fluorescence intensity ratio is FISiR/FIMaP555. (D) Flow cytometry profiles of cells stained with SiR-Halo or SiR-T5 (500 nM). U2OS expressing no HaloTag7 or Histone2B-HaloTag7 fusions. Sideward scatter (SSC) vs. SiR fluorescence intensity (SiR FI) are presented. (E) Confocal microscopy images of Histone2B-HaloTag7 16 h after cell sorting with SiR-Halo or -T5 (500 nM). Restaining using Hoechst (1 μg/mL) and MaP555-CA (500 nM).

