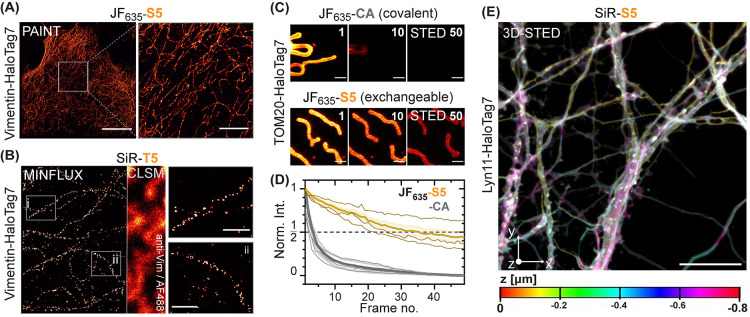
Figure 5.
(A) HaloTag-PAINT image of a fixed U2OS cell endogenously expressing vimentin-HaloTag741 labeled with JF635-S5 (5 nM). Scale bar: 10 μm (overview) and 2 μm (magnified region). (B) 2D-MINFLUX microscopy image of fixed U2OS cells expressing vimentin-HaloTag7 labeled with SiR-T5 (2 nM). Vimentin immunostaining (AF488) and confocal laser-scanning microscopy (CLSM) imaging was used as a reference. Magnification reveals vimentin-HaloTag7 molecules with a localization precision of ∼3.9 nm. Intensities are represented in arbitrary units from 0 to 3 (overview) or 0 to 12 (magnified region). Scale bars: 0.2 μm. (C) Multiframe STED images of U2OS mitochondria outer membrane (TOM20-HaloTag7) labeled with JF635-CA or JF635-S5. Frame numbers indicated in the top right corner. Scale bar: 1 μm. (D) Bleaching curves (thick lines: mean value and S.D., thin lines: individual experiments) from similar experiment as shown in C. (E) 3D-STED image of Lyn11-HaloTag7 (plasma membrane) from live cultured rat hippocampal neurons labeled with SiR-S5. An area of 40 × 40 μm (x–y, 80 nm pixel-size) was recorded in 20 nm z-stacks over 40 times (0.8 μm z-depth). Max. projection and depth color-coding. Scale bar: 10 μm.

