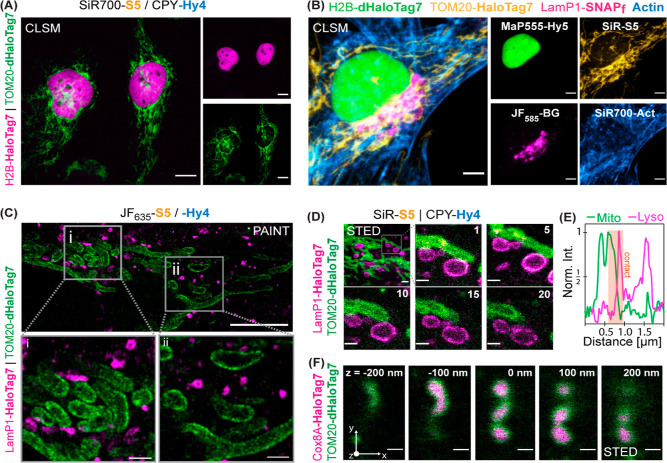
Figure 7.
(A) Dual-color live-cell confocal images using combinable xHTLs. U2OS cells expressing H2B-HaloTag7 and TOM20-dHaloTag7 labeled with SiR700-S5 and CPY-Hy4 (500 nM). Scale: 10 μm. (B) Four-color confocal image of a U2OS cell live stained using orthogonal xHTLs, SNAP-tag. and a SiR700-actin probe (c). MaP555-Hy5, SiR-S5, and JF585-BG were used to label H2B-dHaloTag7 (nucleus), TOM20-HaloTag7 (mitochondria surface), and LamP1-SNAP-tag (lysosome), respectively. Scale: 5 μm. (C) Dual-target Exchange-PAINT image of mitochondria and lysosomes of fixed U2OS cells using combinable xHTLs. Cells expressing TOM20-HaloTag7 and LamP1-dHaloTag7 via T2A fusion. Sequential labeling and imaging using JF635-S5 (5 nM, magenta) and JF635–Hy4 (3 nM, green). Scale bars: 10 μm (overview) or 1 μm (magnified region). (D) Dual-color time-lapse STED images of mitochondria-lysosome dynamics in live U2OS cells. Cells labeled with 500 nM xHTLs. Imaging over 20 consecutive frames, 2 frames/minute, 10 μm2 area. Frame numbers indicated in the top right corner. SiR- and CPY-xHTLs were chosen for their higher brightness in STED imaging. Scale bars: 2 μm (overview) or 0.5 μm (magnified region). (E) Line-scan profile across a lysosomal vesicle mitochondria contact site. (F) 3D-STED images of xHTL-stained U2OS mitochondria. Cells express Cox8A-HaloTag7 (inner membrane) and TOM20-dHaloTag7 (outer membrane) via T2A fusion and were labeled with SiR-S5 and CPY-Hy4 (500 nM). An area of 2.44 × 3.20 μm (x–y) was recorded in 50 nm z-stacks over 40 times; z-plains are indicated in the top right corner. Scale bar: 0.5 μm.

