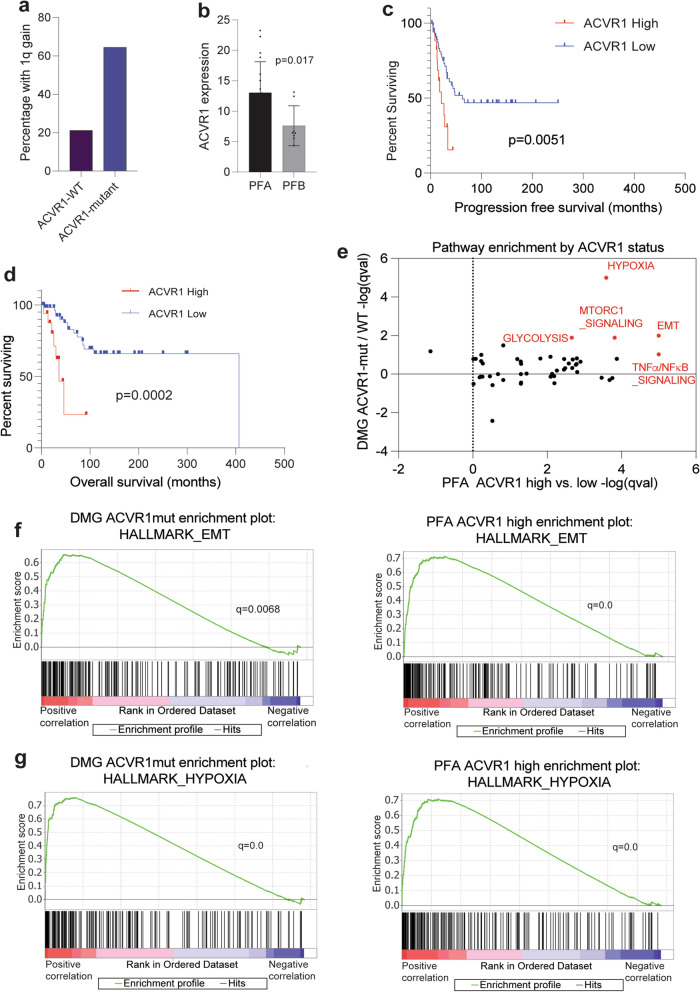
Fig. 2.
ACVR1 expression is prognostic in PFAs and associated with transcriptomic signatures observed in ACVR1-mutant DMGs. a Frequency of 1q gain (Y-axis) in ACVR1-mutant (n = 31) vs. WT (n = 137) H3K27M DMGs from Mackay et al. [36]. b ACVR1 RNA expression levels (Y-axis) in PFAs (n = 19) compared to PFBs (n = 8) from Bayliss et al. 2016 [31]. Data analyzed by unpaired, two-tailed t test. c Progression-free survival (months) analysis comparing PFAs with ACVR1 high (the top quartile, n = 19) vs. low (lower three quartiles, n = 57) expression. d Overall survival (months) analysis comparing PFAs with ACVR1 high (the top quartile, n = 19) vs. low (lower three quartiles, n = 57) expression. Data in 2c-d analyzed using Kaplan–Meier, Log-Rank test with 95% confidence intervals. e Comparison of enriched pathways from differentially expressed genes in ACVR1-mutant vs. -wildtype H3K27M DMGs (from 2a, Y-axis) and ACVR1-high vs. -low PFAs (from 2d, X-axis). f Gene set enrichment analyses of the Hallmark epithelial-to-mesenchymal transition (EMT) pathway for genes ranked by differential expression in ACVR1-mutant DMGs or in high ACVR1 expressing PFAs. g Gene set enrichment analyses of the Hallmark hypoxia pathway for genes ranked by differential expression in ACVR1-mutant DMGs or in high ACVR1 expressing PFAs

