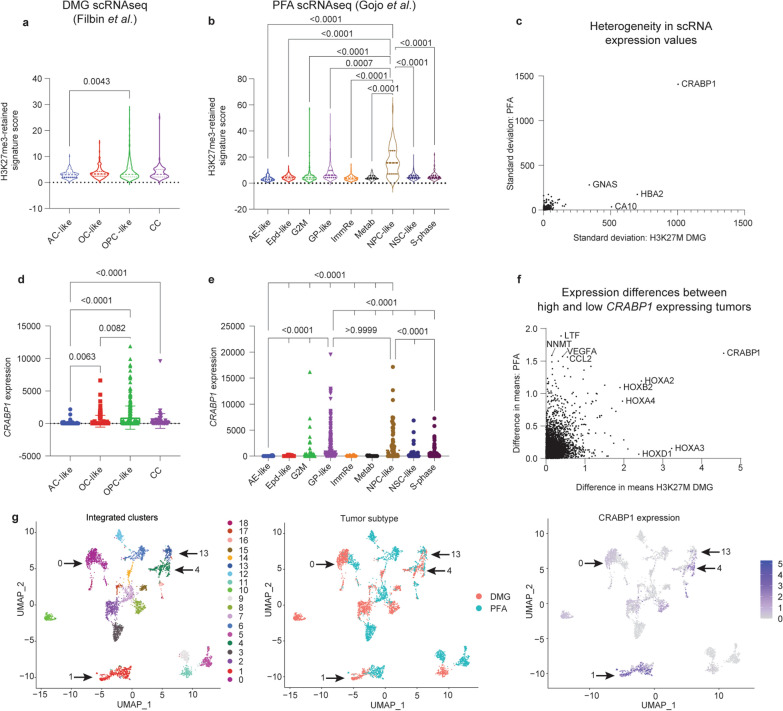
Fig. 5.
H3K27me3-enriched CRABP1 is expressed highly in progenitor populations of both tumors. a Expression of the shared H3K27me3-retaining gene signature across cell-types in scRNA-seq data from H3K27M DMGs (Filbin et al.) [4]. Expression scores per cell were determined as the average expression of all genes in each cell. b Expression of the shared H3K27me3-retaining gene signature across cell-types in scRNA-seq data from PFA ependymomas (Gojo et al.) [6]. Only p-values for comparisons involving NPC-like cells are shown. c Comparison of the heterogeneity in expression of H3K27me3-retaining genes as measured by the standard deviation in expression of each H3K27me3-retaining gene in H3K27M DMGs (X-axis) and PFA ependymomas (Y-axis). Genes for which expression data was not available in both bulk expression data sets were excluded from plotting. 397 genes were plotted. d CRABP1 expression values per cell from scRNA-seq data in H3K27M DMGs, grouped by cell type. e CRABP1 expression values per cell from scRNA-seq data in PFAs, grouped by cell type. Only p-values for comparisons involving NPC-like and GP-like cells are shown. f Analysis of genes co-expressed with CRABP1 in bulk RNA-seq datasets by comparison of difference in means for CRABP1-high and CRABP1-low tumors in H3K27M DMGs (X-axis) and PFA ependymomas (Y-axis). A split at the mean expression of CRABP1 from the Mack et al. dataset was used to delineate H3K27M DMG CRABP1-high (n = 37) and CRABP1-low tumors (n = 46). A split in the mean expression of the highest-level CRABP1 probe from the Pajtler et al. dataset was used to delineate PFA CRABP1-high (n = 22) and -low tumors (n = 56). g Uniform Manifold Approximation and Projection (UMAP) embeddings of integrated scRNA-seq datasets of H3K27M DMG (Filbin) and PF ependymoma (Gojo). Left: identification of 20 distinct clusters. Middle: labeling by tumor of origin. Right: CRABP1 expression across single cells with color scale minimum set to 0. Kruskal–Wallis test followed by multiple comparisons analysis were used to analyze data in a–b and e–d

