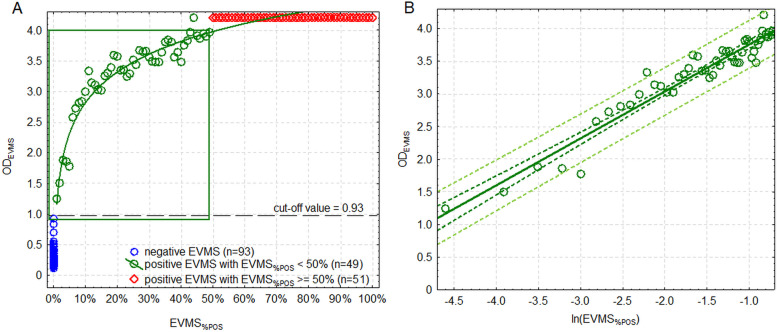
Fig. 2.
A (left): The relationship between the proportion of seropositive individual milk samples in the equal-volume milk sample (EVMS%POS, showed in logarithmic transformation) and optical density of EVMS (ODEVMS) in indirect ELISA based on recombinant transmembrane and capsid proteins (TM/CA-iELISA). Green rectangle depicts the range of ODEVMS in which the model allows for estimation of EVMS%POS; B (right): Linearized regression function from the range presented in a green rectangle in the Fig. 2 A. Dark green broken line is a 95% confidence interval of the linear regression (green solid line). Light green broken line is a 95% prediction interval. Black broken line is a cut-off separating positive and negative EVMS

