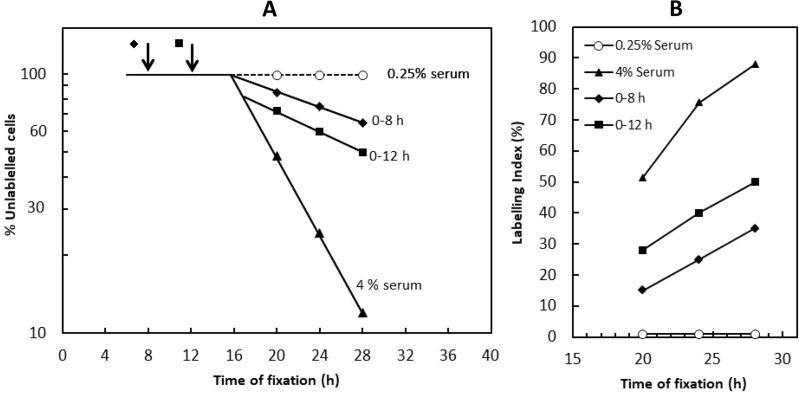
Fig. 1.
Continued passage of the Restriction Point after a serum step-down
A Schematic adapted from Fig. 2b of [14]. Serum-starved Swiss 3T3 cells were stimulated with 4% serum from t = 0 and stepped down to 0.25% serum at either 8 h (⬥) or 12 h (◼), see arrows. Control cells remained in 4% serum throughout (▲) or were transferred to 0.25% serum from the start (○). Labelling with 3H-thymidine was continuous. Cells were fixed at the times indicated and the labelling index determined. The data were plotted on a logarithmic scale as the fraction of cells not yet labelled with 3H-thymidine, i.e. those still in G0/G1. The indicative points shown are representative for cells fixed at 20, 24 or 28 h only. For the full dataset, see [14]
B 3H-thymidine labelling index for cells fixed at 20, 24 or 28 h. Alternative plot from the experiment in panel A, showing continued entry into S phase after the step-down

