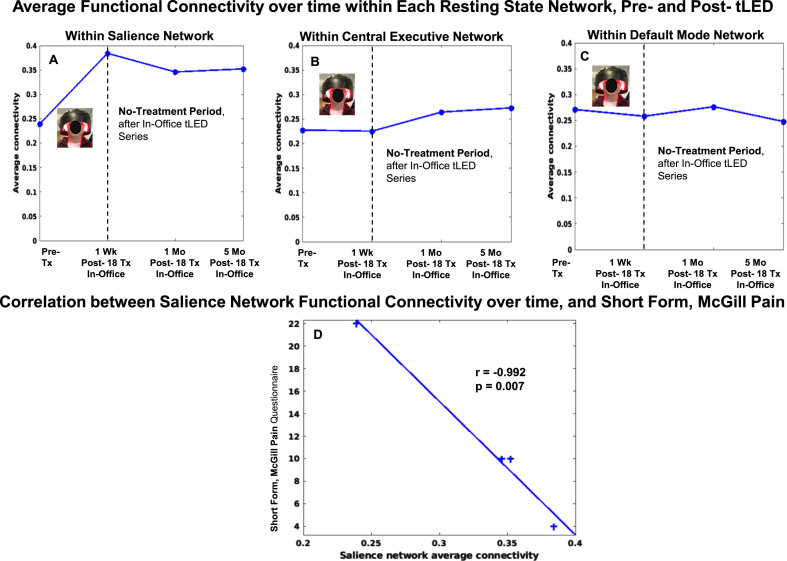
Fig. 10.
P4, rs-fcMRI. Top: Average FC within each network over time, pre- /post- the initial, in-office tPBM series. Compared to pre-treatment, the SN FC showed increase at 1 week, 1 month, and 5 months. Bottom: Significant negative correlation was present between increased SN FC over time, and decreased SF-MPQ pain ratings (D). rs-fcMRI, resting-state functional-connectivity MRI; SN, salience network; CEN, central executive network; DMN, default mode network.

