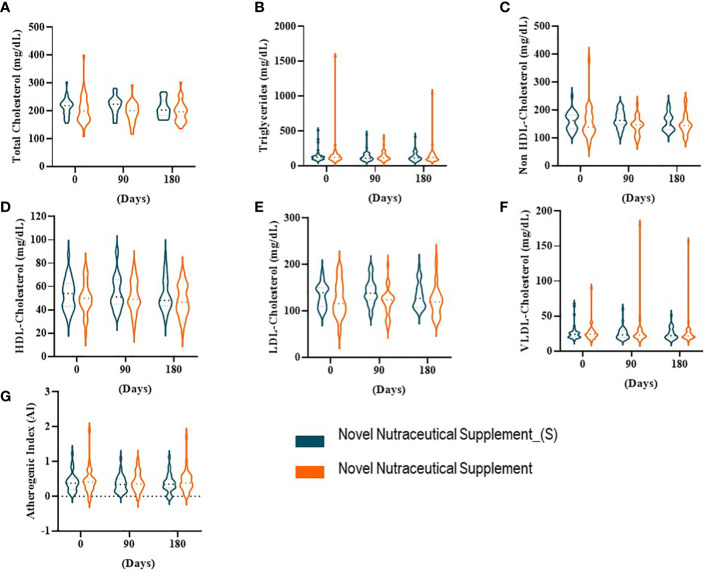
Figure 2.
Lipid profile at baseline time (Day 0) and 90 and 180 days post-supplementation. (A) Total cholesterol. (B) Triglycerides. (C) Non-HDL-cholesterol. (D) HDL-cholesterol. (E) LDL-cholesterol. (F) VLDL-cholesterol. (G) Atherogenic index (AI). Novel Nutraceutical Supplement_(S) (n = 30) and Novel Nutraceutical Supplement (n = 29). Values are expressed as mean ± SEM or median (min to max, box plot) by plot violin graphic. HDL, high-density lipoprotein; LDL, low-density lipoprotein; VLDL, very-low-density lipoprotein.

