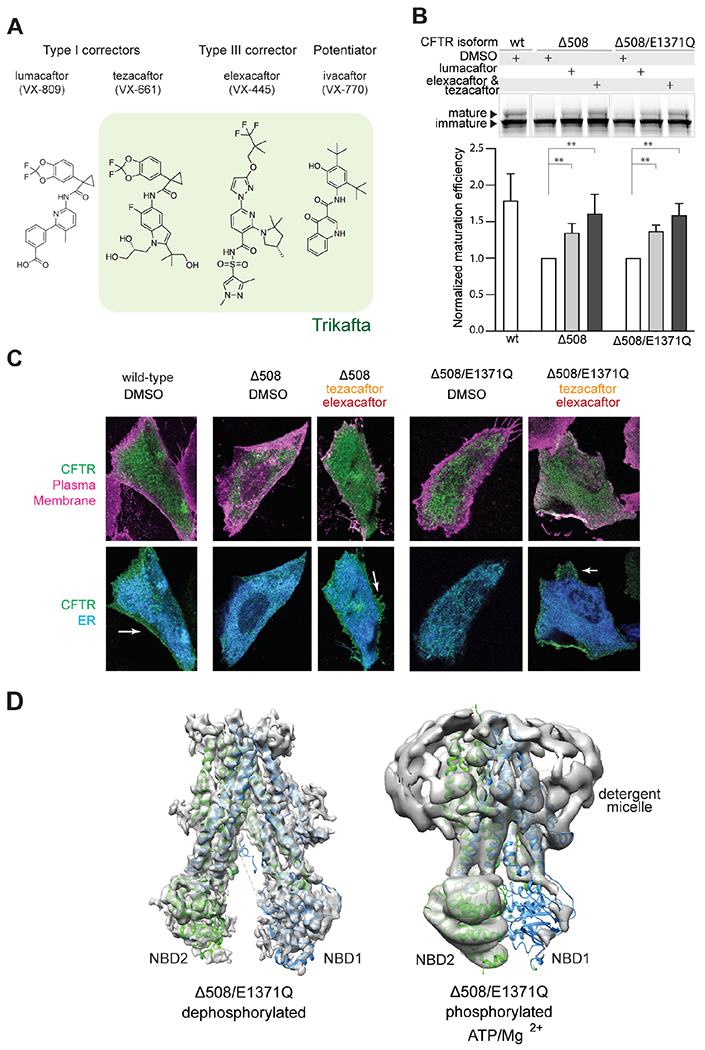
Fig. 1. Δ508 CFTR exhibits defective NBD assembly.

(A) Four CFTR modulators currently used in the clinic. Green highlights the composition of the triple therapy (Trikafta in the US and Kaftrio in the EU). (B) Maturation assay in HEK293F cells. Upper panel: SDS-PAGE of cell lysates; mature and immature CFTR were visualized with a C-terminal GFP tag. Lower panel: Quantification of n = 3-6 biological repeats. Standard deviation (SD) indicated by error bars. Lumacaftor, 1 μM; tezacaftor, 10 μM; elexacaftor, 0.5 μM in 0.1% DMSO. Statistical significance calculated using paired t-test. **: 0.001 < p < 0.01. (C) Confocal Laser Scanning Microscopy analysis. CHO cells expressing CFTR variants were treated with DMSO (control) or 10 μM tezacaftor and 0.5 μM elexacaftor. ER (blue) visualized by exciting mCherry-tagged Tapasin. Plasma membrane (magenta) visualized by exciting Alexa Fluor 647-conjugated wheat germ agglutinin staining. CFTR (green) visualized by exciting eGFP-tagged CFTR. (D) Structures of dephosphorylated and phosphorylated, ATP-bound Δ508/E1371Q CFTR. Cryo-EM maps (grey) are superposed with structures of full-length CFTR in the same conditions (dephosphorylated PDB, 7SVR; phosphorylated, ATP-bound PDB, 7SVD).
