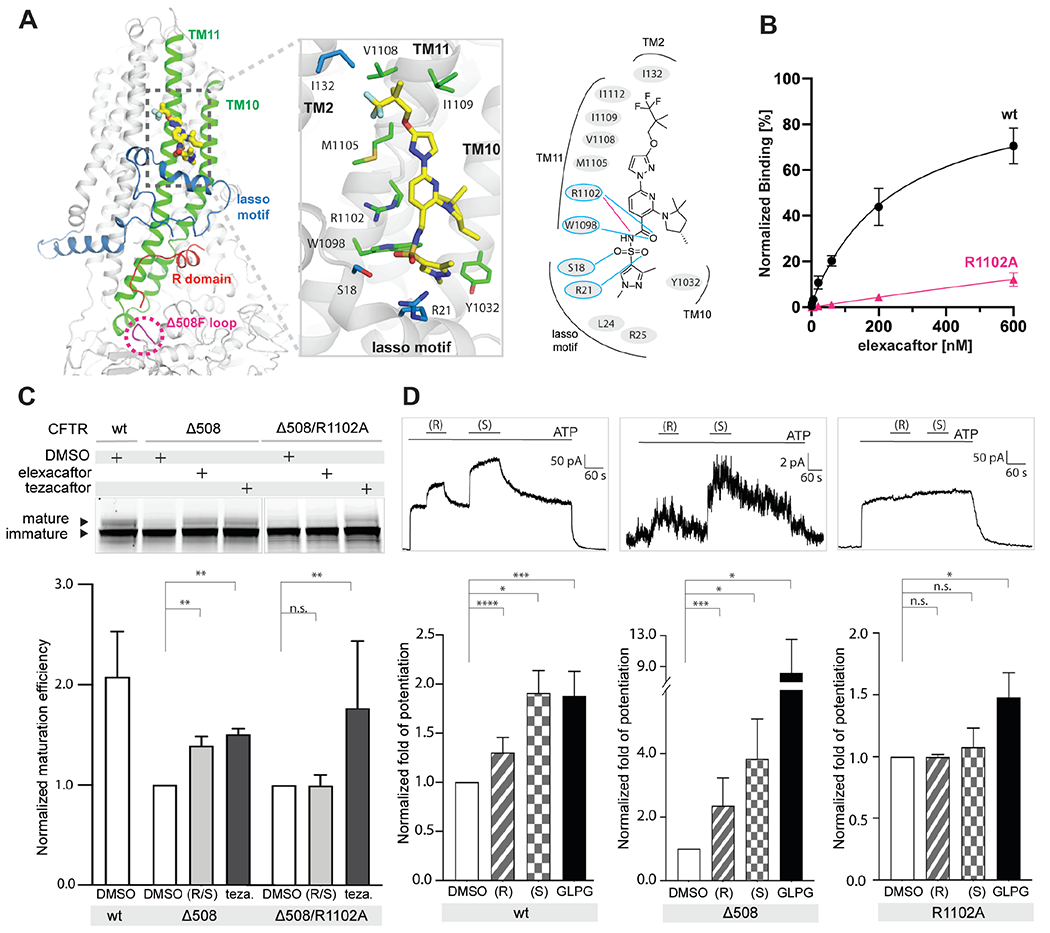
Fig. 4. The elexacaftor binding site.

(A) Molecular structure of elexacaftor binding site. Left panel: ribbon diagram. Middle panel: zoomed-in view of molecular interactions. Residues within 4.5 Å of elexacaftor shown as stick models. Right panel: schematic of molecular interactions. Salt bridge, magenta line; hydrogen bonds, blue lines. (B) Quantitative measurement of elexacaftor binding. Data points represent mean and SD for n = 6-12 technical (3-4 biological) repeats. Apparent Kd of elexacaftor for WT CFTR, 244 ± 50 nM. (C) R1102A mutation diminishes correction by elexacaftor. Upper: SDS-PAGE of cell lysates. Lower: Quantification of n = 3 biological repeats. Labels: (R/S), racemic mixture of elexacaftor (0.5 μM); Teza, tezacaftor (10 μM). (D) Elexacaftor potentiation. Upper: Representative macroscopic current traces of fully phosphorylated WT and mutant CFTR in inside-out CHO cell membrane patches. Lower: Quantification of n = 3-8 biological repeats. Concentrations used: ATP, 3 mM; elexacaftor, 1 μM; GLPG1837, 10 μM. Fold potentiation normalized to currents with 3 mM ATP in the absence of potentiators. Statistical significance calculated using paired t-test. Labels: not significant, n.s.; p < 0.05, *; p < 0.01, **; p < 0.001, ***; p < 0.0001, ****.
