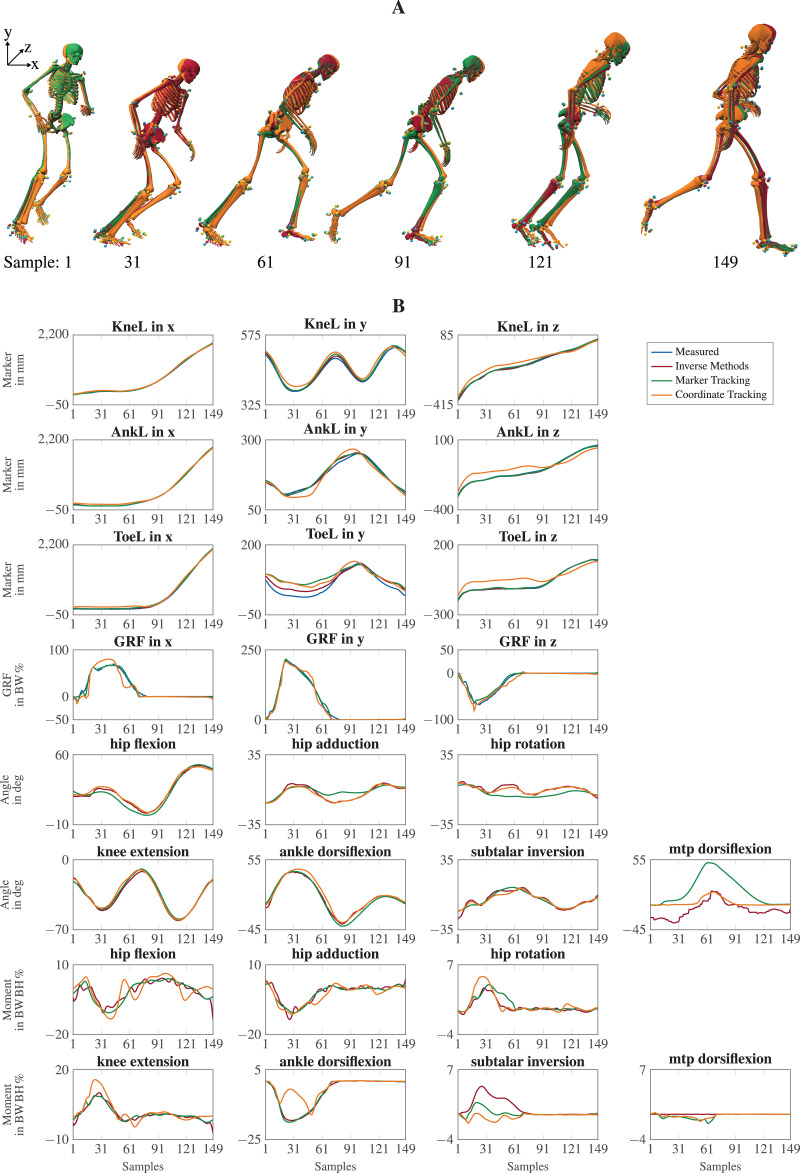
Figure 3. Kinematics including horizontal offset for visualization (A) and a selection of trajectories of the right leg (B) for a v-cut.
The result of inverse kinematics, coordinate tracking, and marker tracking is represented in red, orange, and green, respectively. Measured marker positions are displayed in blue. The motion had in total 149 samples at 175 Hz. GRFs were scaled to body-weight percent (BW%) and joint moments were scaled to body-weight body-height percent (BW BH%).

