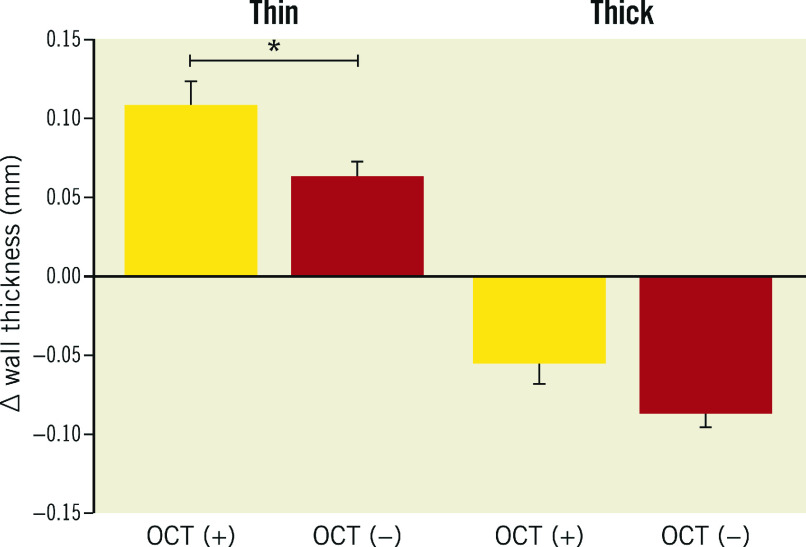
Figure 3. Wall thickness progression in thin and thick artery wall sectors, as assessed by IVUS at baseline, stratified for the presence and absence of OCT-detected lipid plaque.
Yellow: OCT-lipid plaque positive sectors (OCT [+]); red: OCT-lipid plaque negative sectors (OCT [−]); thin (plaque-free) <0.5 mm wall thickness by IVUS; thick ≥0.5 mm wall thickness by IVUS. * p<0.001. IVUS: intravascular ultrasound; NIRS: near-infrared spectroscopy; OCT: optical coherence tomography

