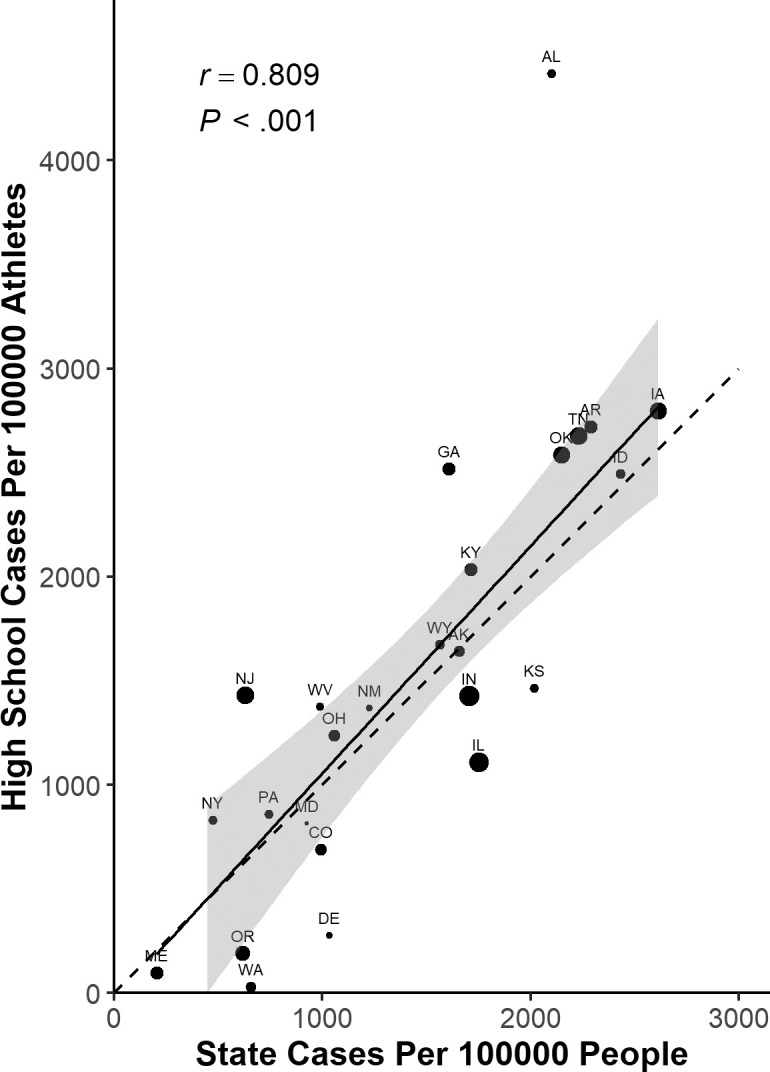
Figure 3.

Reported COVID-19 case rates for high school athletes and the general populations of their respective states during fall 2020. The size of the point is scaled to the number of players from each state, and the dashed line represents a line of equality. The solid line and shaded area represent the regression line and 95% CI from the linear model weighted for the number of players from each state. Abbreviation: r = correlation coefficient.
