FIGURE 2.

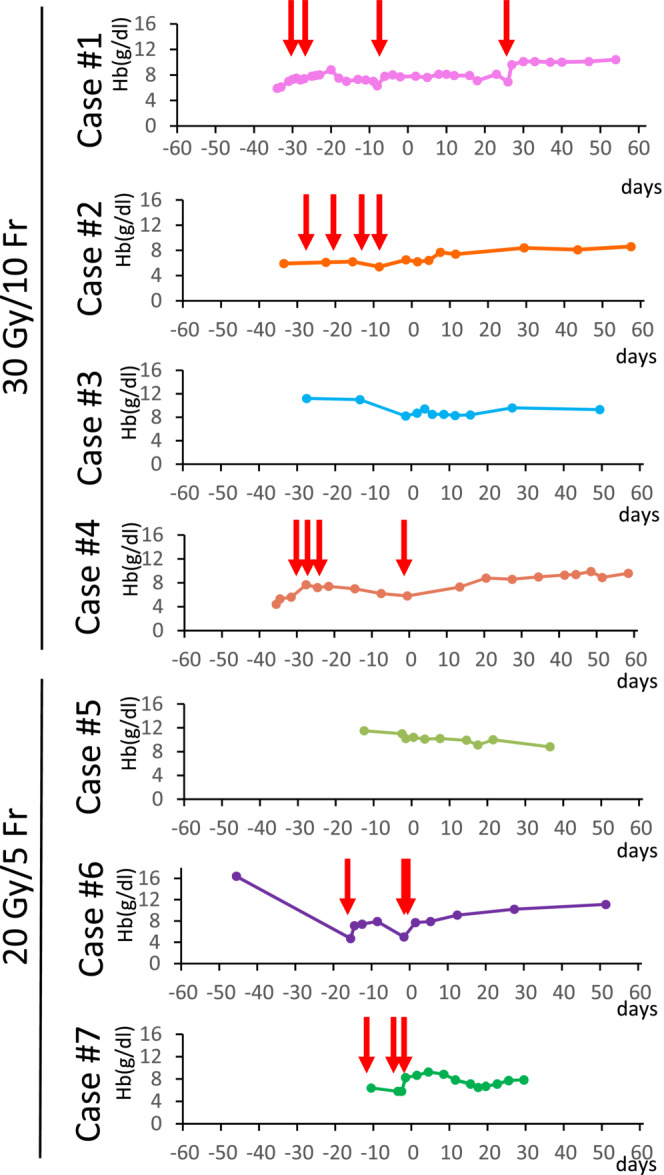
Kinetics of hemoglobin levels within 2 months pre‐ and post‐radiation therapy (RT). Day 1 indicates the day of initiation of RT. Red arrows indicate blood transfusion.

Kinetics of hemoglobin levels within 2 months pre‐ and post‐radiation therapy (RT). Day 1 indicates the day of initiation of RT. Red arrows indicate blood transfusion.