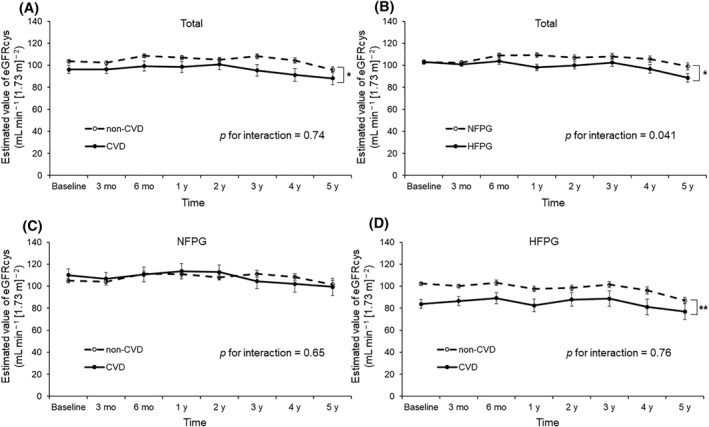
FIGURE 1.

A generalized linear mixed model (GLMM) for the assessment of changes in eGFRcys during follow‐up. Panel A shows the changes in eGFRcys over time with adjustment for sex, age, body mass index (BMI), systolic blood pressure (SBP), and fasting plasma glucose (FPG) in all patients. Panel B shows the changes in eGFRcys with adjustment for sex, age, BMI, and SBP according to baseline FPG levels. Panels C and D show the changes in eGFRcys over time with adjustment for sex, age, BMI, SBP, and FPG in the normal FPG group (NFPG) and HFPG groups, respectively. Total population, n = 318; population with CVD, n = 36; NPFG group, n = 163; NFPG with CVD group, n = 17; HPFG group, n = 155; NFPG with CVD group, n = 19. *p < 0.05, **p < 0.01. CVD, cardiovascular disease; eGFRcys, estimated glomerular filtration rate calculated using serum cystatin C; FPG, fasting plasma glucose; HFPG, high fasting plasma glucose; NFPG, normal plasma blood glucose
