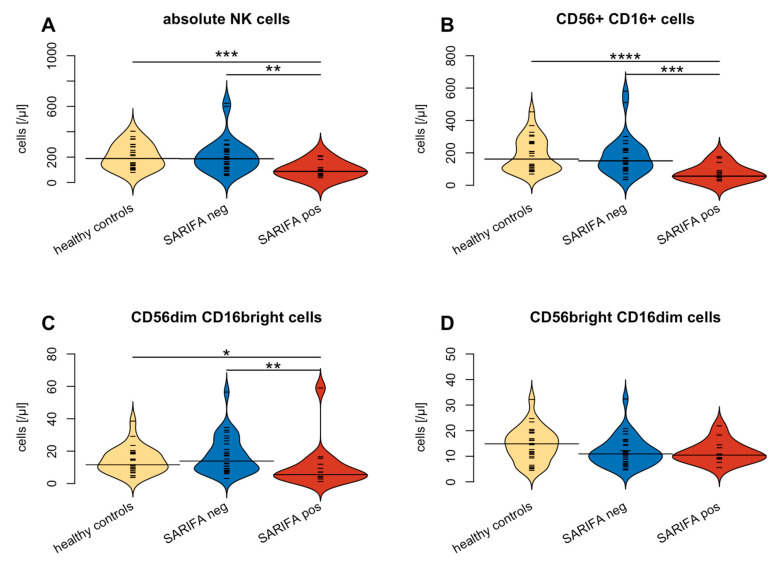
Figure 3.
Comparison of NK cells in general (A) and CD56+ CD16+ subtype (B) as well as between CD56dim CD16bright (C) and CD56bright CD16dim (D) NK cell subtypes between healthy controls (yellow), SARIFA-pos(itive) (red) and SARIFA-neg(ative) (blue) CRC patients. Small white lines indicate individual data points; large black lines show the overall subset average of SARIFA-positive and SARIFA-negative CRC patients, respectively. * p < 0.05, ** p < 0.01, *** p < 0.001, **** p < 0.0001.

