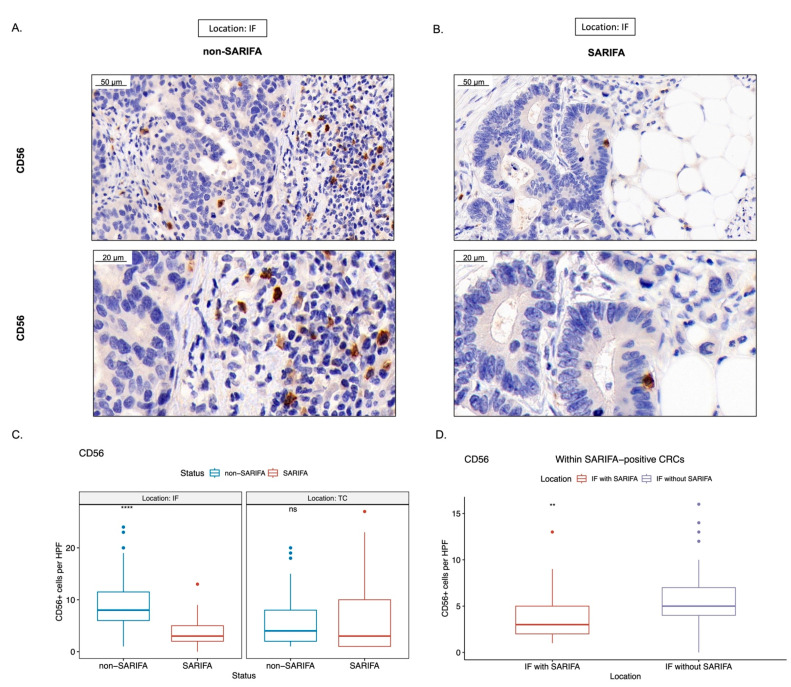
Figure 4.
Representative immunohistochemical stains for CD56 ((A,B); scale bar = 50 µm and 20 µm, respectively). Boxplots showing the amount of CD56+ lymphocytes per high-power field (HPF, 400×), comparing between SARIFA-positive (SARIFA) and SARIFA-negative CRCs (non-SARIFA) at IF and TC (C) and comparing SARIFAs vs. non-SARIFAs, only within SARIFA-positive CRCs (D) as SARIFA-positive CRCs also show non-SARIFAs at the invasive margin (see Figure 1E). ns = not significant (p < 0.05). ** for p < 0.01, **** for p < 0.0001.

