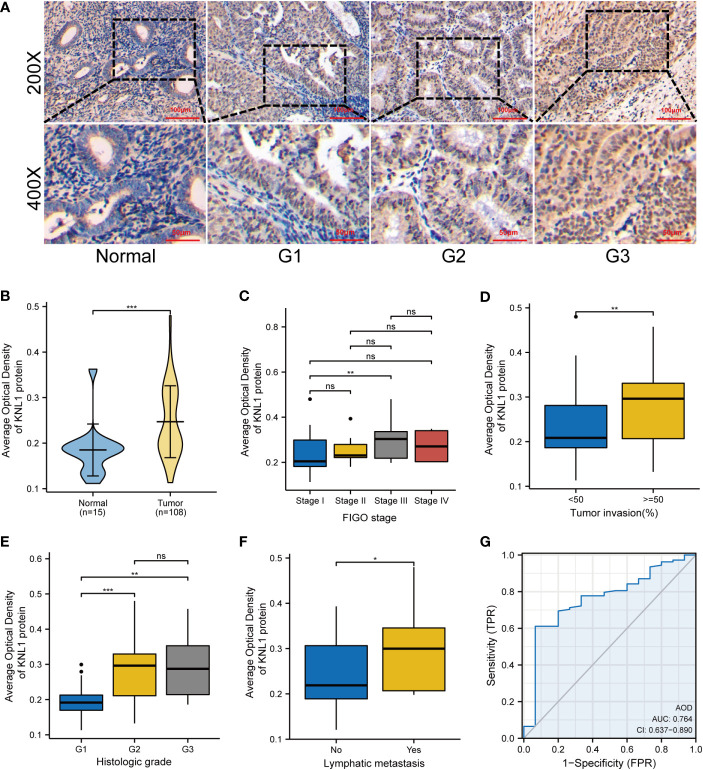
Figure 2.
Expression and clinical correlation analysis of KNL1 in UCEC clinical samples. (A) Immunohistochemical results of KNL1 in normal endometrial tissues and UCEC tissues with different degrees of differentiation. (B) Group comparison of KNL1 immunohistochemical results in 108 UCEC clinical specimens and 15 normal endometrial cancer tissues. (C–F) Group comparison of KNL1 protein expression levels in samples with different clinical characteristics, (C) FIGO stage, (D) Tumor invasion, (E) Histologic grade, and (F) Lymphatic metastasis. (G) The diagnostic ROC curve of KNL1. Significance identifier: ns (no significance), p≥0.05; *, p< 0.05; **, p<0.01; ***, p<0.001.

