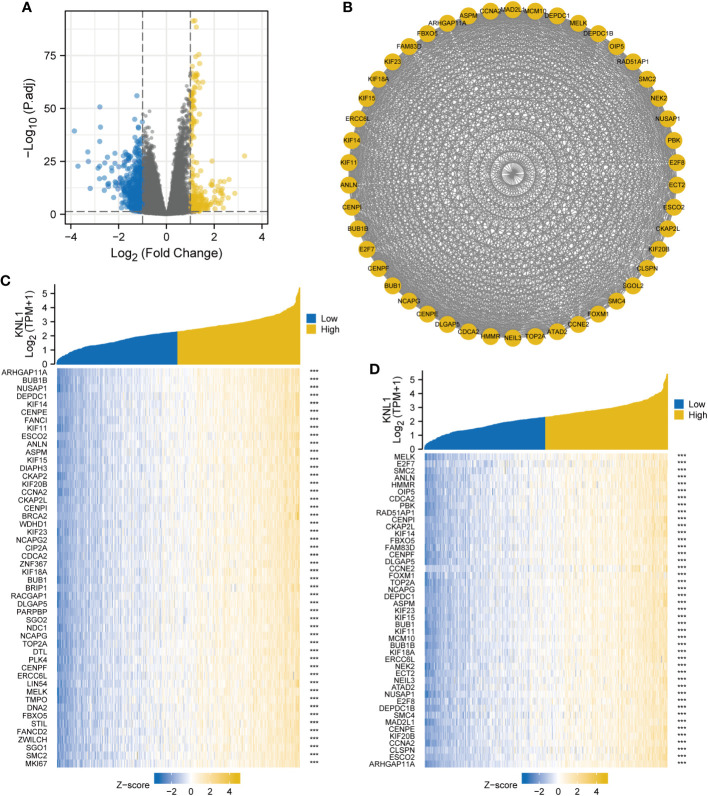
Figure 3.
Single gene differential analysis and correlation analysis of KNL1. (A) Volcano map for single gene differential analysis of KNL1. (B) Protein interaction network diagram (PPI) of the HUB genes. (C) Heatmap of coexpression of the top 50 most correlated genes with KNL1 in single gene correlation analysis. (D) Heatmap of single gene coexpression of the HUB genes and KNL1.

