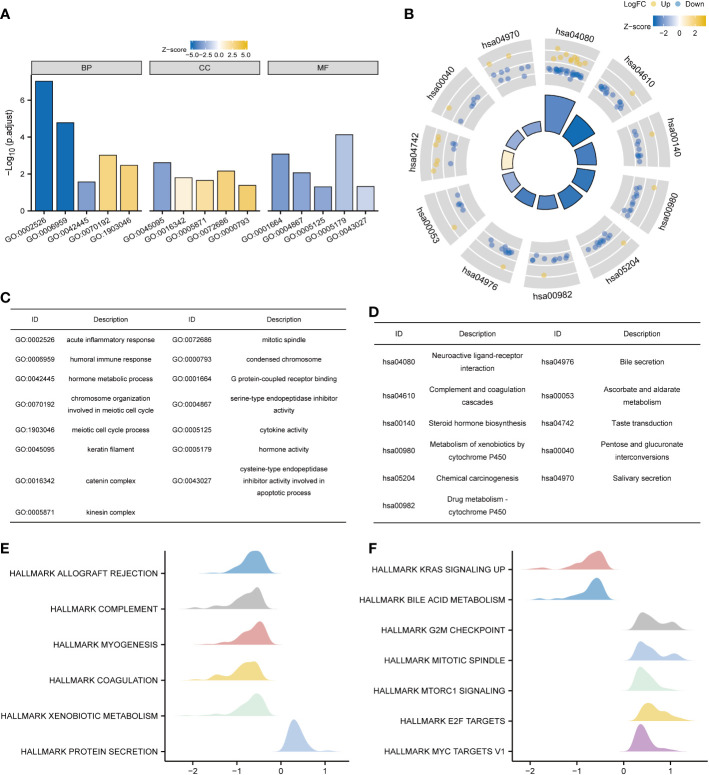
Figure 4.
Functional enrichment analysis of KNL1 and related differentially expressed genes in UCEC. (A) Results of GO analysis. (B) Results of KEGG analysis. (C, D) GO and KEGG analysis category names corresponding to the GO and KEGG Identifier. (E, F) Results of KEGG analysis. When the abscissa was positive, KNL1 expression was positively correlated with this pathway, and when the abscissa was negative, the opposite was observed.

