Figure 5.
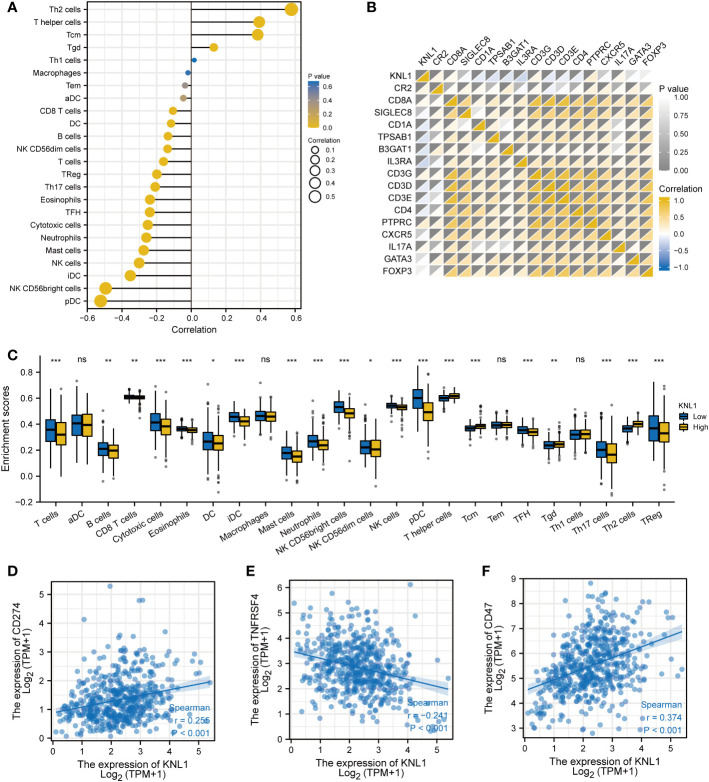
Immunoinfiltration analysis of KNL1. (A) Correlation analysis between KNL1 and 24 immune cell infiltration levels. (B) Heatmap of the correlation between KNL1 expression and various immune cell surface marker proteins: CR2 (B cells), CD8A (cytotoxic cells), SIGLEC8 (eosinophils), CD1A (iDCs), TPSAB1 (mast cells), B3GAT1 (NK cells), IL3RA (pDCs), CD3G (T cells), CD3D (T cells), CD3E (T cells), CD4 (T helper cells), PTPRC (Tcm), CXCR5 (Tfh), IL17A (Th17), GATA3 (Th2), and FOXP3 (Treg). (C) Infiltration levels of 24 kinds of immune cells in samples with different KNL1 expression levels. (D–F) Correlation analysis between KNL1 and the expression levels of CD274, TNFRSF4 and CD47. Significance identifier: ns (no significance), p≥0.05; *, p< 0.05; **, p<0.01; ***, p<0.001.

