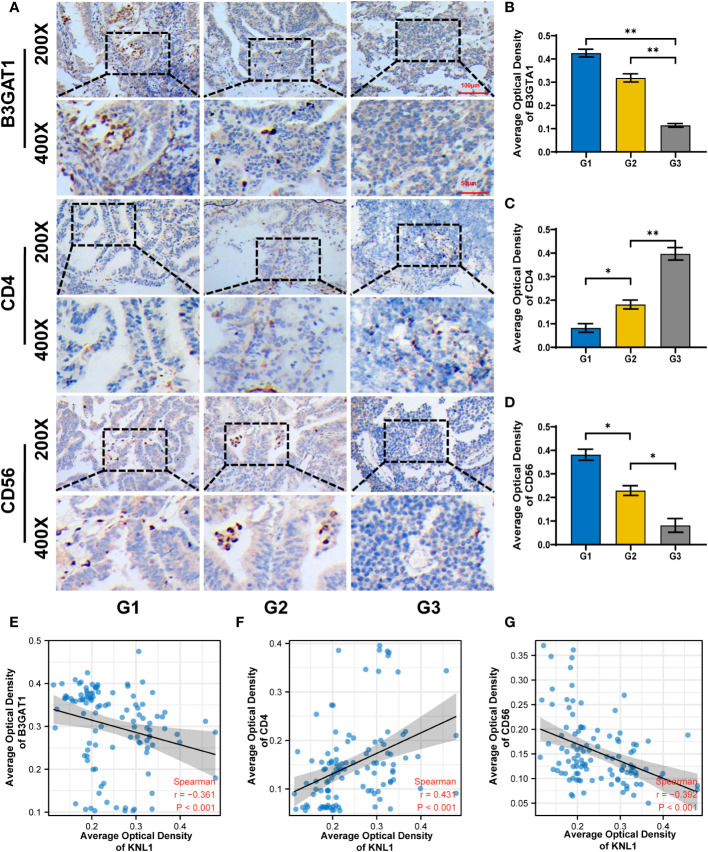
Figure 6.
Correlation between KNL1 expression and the expression of CD4, CD56 and B3TAG1 in patients with UCEC. (A) Immunohistochemical images of CD4, CD56 and B4GAT1 in UCEC patients with different histologic grades. (B–D) Histogram of the immunohistochemical results for CD4, CD56, and B4GAT1. (E–G) Scatter plot of the correlation between the expression levels of CD4, CD56, and B3GAT1 and KNL1. Significance identifier:p≥0.05; *, p< 0.05; **, p<0.01.

